Enemies: Difference between revisions
(gave non-achievement disabling behaviour of command less importance in the text, removed assumption about evo factor in long games) |
(→Evolution: added technical section on estimating EF manually, + charts; collapsed by default, reason: long & likely only of interest to some; ADMIN: if deemed unsuitable for this page / wiki, please suggest in edit summary where else to post it, thx) |
||
| Line 251: | Line 251: | ||
<div id="evoChecker"></div> | <div id="evoChecker"></div> | ||
=== Advanced: Evolution factor components and estimation === | |||
The section below has charts plotting the individual evolution factor components and discusses possibilities for manually estimating the evolution factor. (Click to expand.) | |||
<div class="toccolours mw-collapsible mw-collapsed" style="width:900px; overflow:auto;"> | |||
[[File:ef-base.png|400px|thumb|right|1. Single-component evolution factor increase with time]] | |||
[[File:ef-pollution.png|400px|thumb|right|2. Single-component evolution factor increase with pollution]] | |||
[[File:ef-spawner.png|400px|thumb|right|3. Single-component evolution factor increase with destroyed spawners]] | |||
'''Notes''' | |||
*All charts end at approximately an evolution factor of 0.99. | |||
*To simplify calculation, the time and pollution charts are calculated using steps of 1,000 seconds / 1,000,000 pollution units - in both cases 1,000 times larger than the unit the game uses for the calculation. Because of the recursive nature of the calculation, this makes the values in the charts somewhat '''lower''' than those the game would obtain in the same calculation; however, the difference is fairly minimal (less than 1 percentage point). The spawners chart is calculated 1-to-1 and therefore accurate. | |||
*While time passed is shown on save files and spawners destroyed can be retrieved from player statistics, the game does not currently report the total pollution released by the player. Also, none of the well-known Factorio calculators show pollution generated by a particular factory. Therefore, to make use of the pollution chart the player's pollution output would need to be manually estimated. | |||
*Given that the game reports the actual evolution factor (console: <code>/evolution</code>) whenever the player wishes, these charts are intended primarily to help estimate the impact of planned base expansions and similar activities on the evolution factor's future development. | |||
'''Comments''' | |||
These charts (click to enlarge) represent the situation where each evolution factor component (time, pollution, destroyed spawners) is the ''only'' component contributing to the evolution factor in that entire game. They are therefore '''not realistic''', as in a typical game all three components will contribute, some at varying times and intensities. | |||
Because of how contributions to the evolution factor (hereinafter, EF) are calculated (multiplied by <code>(1 - current EF)</code>), it is '''not''' possible to simply add the values indicated by these charts for a game's time passed, pollution generated, and / or spawners destroyed so far to retrieve the total evolution factor. | |||
For example, if 20 hours have passed (single-component EF =~ 0.25), 10 million pollution units were released (single-component EF =~ 0.15), and 200 spawners were destroyed (single-component EF =~ 0.35), the actual evolution factor will '''not''' be (0.25 + 0.15 + 0.35 =) ~0.85. | |||
However, the evolution factor will always be '''less''' than the sum of all individual components as indicated by these charts, and '''at least''' as high as the highest individual component. Thus, using the values from above, the EF will be ''at least'' 0.35 and ''less than'' 0.85. More detailed interpolation would require one to know exactly when individual spawners were destroyed and each 1,000th unit of pollution released, which is practically impossible to track. | |||
'''Estimation of actual evolution factor''' | |||
A ''very approximate'' way to estimate the actual EF would be to sum the values from the three charts as <code>E[t] + E[p] * (1 - E[t]) + E[s] * [1 - E[t] - E[p] * (1 - E[t])]</code>, where ''E[t]'', ''E[p]'', and ''E[s]'' are the single-component values from the pollution, time, and spawner charts, in that order. | |||
That is equivalent to assuming that first, all time passed, then, all pollution was released, then, all spawners were destroyed. While generally not true, it is at least a reasonable approximation given that usually, both pollution production and spawner destruction tend to increase as the game progresses and the player advances. Note that the result can both under- and overestimate the actual value, depending on the precise timing of pollution production and spawner destruction. | |||
For the values from above, the estimate would return <code>0.25 + 0.15 * (1 - 0.25) + 0.35 * [1 - 0.25 - 0.15 * (1 - 0.25)]</code> = <code>0.25 + 0.1125 + 0.223125 = 0.585625</code> =~ <code>0.60</code>. Note that given the likely size of the error on such an estimate, rounding to the nearest 0.05 is unlikely to be a source of much further imprecision. | |||
A similar method can be used to estimate impact of future player activities on the EF: Simply have the game print the current EF, then perform the estimate from the charts, as above, for ''future'' activities only, and multiply the estimate result by <code>(1 - E[a])</code>, where ''E(a)'' is the actual current EF returned by the game. | |||
For example, if the player planned to spend the next 20 hours building up their base, releasing 10 million pollution and destroying 200 spawners in the meantime (i.e., the same numbers as in the example above), and the EF at the start of the project were, say, 0.55, then the estimated EF at project end would be <code>0.55 + (1 - 0.55) * 0.585625</code> = <code>0.55 + 0.26353125 = 0.81353125 </code> =~ <code>0.80</code>. | |||
</div> | |||
== History == | == History == | ||
Revision as of 21:34, 28 August 2018
Enemies (also commonly called biters) are creatures that want to harm the player. They are the native inhabitants of the extraterrestrial world in the form of arthropods living in organic nests, coexisting with each other peacefully. They are encountered in three species: Biters, Spitters and Worms. The species are further distinguished in four (or three in case of Worms) stages of growth and thus strength.
Achievements
Enemies are directly connected to the following achievements:

|
It stinks and they don't like it |

|
Steamrolled Destroy 10 spawners by impact. |
Creatures
Biters
Biters are one of two main antagonists in the game. They come in four sizes: small, medium, big and behemoth. In the beginning of a game, there will only be the small ones. With increasing pollution, they will become bigger, related to the enemy's evolution. As common sense may suggest, their method of attack is a straightforward charge to "bite" things.
| Picture | Name | Info |
|---|---|---|
| File:SmallBiter-anim.gif | Small Biter | Weakest of biters, can be easily killed with a pistol.
|
| File:MediumBiter-anim.gif | Medium Biter | Stronger and slower than the small biter. Can pose a problem for and even kill weaker players.
|
| File:BigBiter-anim.gif | Big Biter | Dangerous, resistant to small arms. Can attack through walls, hitting objects directly behind them.
Resistances:
|
| File:BehemothBiter-anim.gif | Behemoth Biter | Extremely durable and nearly immune to small arms, except for the strongest ordnance. Can attack through walls, hitting objects directly behind them.
Resistances:
|
Spitters
Spitters are much like Biters and only appear slightly later on in the game as the evolution factor increases. Their main difference from Biters is their ranged attack. The attack is unavoidable and always hits the intended target. It is also acid-based, and because most entities of the game have a much lower resistance to acid than other damage types (including turrets and armor), Spitters are effectively more potent against the player and his factories. Their behaviour and size classification are the same as with Biters, but their health is universally lower and they are resistant exclusively against explosives, with no physical resistance.
| Picture | Name | Info |
|---|---|---|
| File:SmallSpitter.png | Small Spitter | Weakest of spitters. Easy to kill with any weapon, but attacks at range.
|
| File:MediumSpitter.jpg | Medium Spitter | Stronger and slower than the smaller version. Can pose a problem for and even kill weaker players.
Resistances:
|
| File:BigSpitter.png | Big Spitter | An even bulkier spitter and so can take more damage.
Resistances:
|
| File:BehemothSpitter.jpg | Behemoth Spitter | The bulkiest of the spitters and so can take even more damage.
Resistances:
|
Worms
The Worms are natural allies of Biters and Spitters and will attack the player if they get close enough with an attack similar to Spitters'. They act like static turrets and will not follow attackers. They rely on high damage and great range to keep the player away from the Worms and the nests they protect, but either one of these advantages can be overcome. Unlike other enemies, they are also highly resistant to fire.
Worms come in 3 sizes, their power increasing with size. Unlike Biters and Spitters, Big and Medium Worms are not influenced by the evolution factor, they can spawn at any size right from the beginning. They are not restricted to spawning close to nests, either. The number and size of Worms spawning is instead influenced by the distance from the player's initial spawn point. The further away the player goes from the starting area, the more numerous and stronger the Worms become.
| Picture | Name | Description |
|---|---|---|
| File:SmallWorm.png | Small Worm | A weak worm. It is still capable of killing the player unless it is targeted as priority.
|
| File:MediumWorm.png | Medium Worm | Medium worms are dangerous to even more advanced players. They should be handled with care.
Resistances:
|
| File:BigWorm.png | Big Worm | Big worms are not as much more dangerous as resilient. They are almost immune to common gunfire of any sort.
Resistances:
|
| Picture | Name |
|---|---|
 |
Worm's animation |
Nests
The spawn points of Biters and Spitters. While nests themselves are generally defenseless, the enemies they release over time effectively serve as a form of guards to distract the player and any nearby turrets, and are often accompanied by Worms. Nests exposed to pollution will use it to evolve the enemies they spawn, which may also result in an attack.
The Nests are highly resistant to fire and otherwise generally more resilient than a Medium Worm.
| Picture | Name | |
|---|---|---|
| File:Biternest-anim.gif | Biter's Nest |
Resistances:
|
| File:Spitternest.gif | Spitter's Nest |
Resistances:
|
Expansions
Every 4-60 minutes, a group of 5-20 biters will leave their base to create a new base. This group will search for a suitable spot that's 3-7 chunks away from existing bases. Once they have found a suitable spot, the group dies and forms a new base. This new base will at first be very small (about one nest and a few worms), but will grow as time passes.
Defense
Biters will only aggressively engage the player's factory if the pollution cloud of the factory reaches a nest. The Nests consume pollution to develop the biters and produce additional ones before sending them to destroy the nearest source of pollution that they consume. The biters then proceed to their target over the shortest path possible, accounting for terrain, but not for player entities that could pose an obstacle (like walls).
If there is a clear path somewhere around those obstacles, the biters will attempt to go around. If there is no clear passage or a clear passage would mean deviating too far from the original course, the biters will attack whatever is in their way to go through. This can be exploited to an extent; creating mazes at regular intervals along a barrier can direct the biters through a gauntlet not dissimilar to Tower Defense.
However, if a biter comes in proximity of the player, turrets or radars, it will prioritize these and attempt to immediately attack them instead, again trying to reach the new target over the shortest possible path with no too great detours, if possible.
Evolution
The evolution factor is a global variable that determines what kind of biters will be spawned. You can check the variable in the dev console via the following command (does not disable achievements):
/evolution
The evolution factor goes from 0 (not evolved at all) to 1 (maximal evolution). At the moment the evolution factor can only increase.
Besides choosing what kind of biter will be spawned, the evolution factor also influences the spawning interval. This interval (spawning_cooldown in the enemy-spawner definition) is interpolated between 360 (0 evolution) and 150 (1 evolution) game ticks (= 6 to 2.5 seconds).
Methods of increasing
The evolution factor is increased by three kinds of events:
- The passage of time very slightly increases the evolution factor.
- The global pollution production increases the evolution factor.
- Destroying nests significantly increases the evolution factor.
All these values are set in game.map_settings.enemy_evolution. From there they can be changed or modded.
The default settings are:
| Source per | Variable in enemy_evolution
|
Percent increase |
|---|---|---|
| Second | time_factor |
0.0004% |
| 1000 Pollution Units | pollution_factor |
0.0015% |
| Destroyed enemy spawner | destroy_factor |
0.2% |
Pollution production is the total pollution produced by buildings per tick, not the pollution spreading on the map, so it is not reduced by trees or other absorbers. e.g. : 15 burner mining drills produce 150 pollution per second, raising the evolution factor by 0.00000225 per tick.
The percentages are applied on the base of 1 - current_evolution_factor. So for instance destroying enemy spawners in the beginning of the game results in increase of evolution factor by 0.005 (half a percent) while doing this when the evolution factor is 0.5 the increase is only 0.0025 (quarter a percent).
This also means that the evolution factor approaches 1 asymptotically - generally, increases past 0.9 or so are very slow and the number never actually reaches 1.0.
Spawn chances by evolution factor
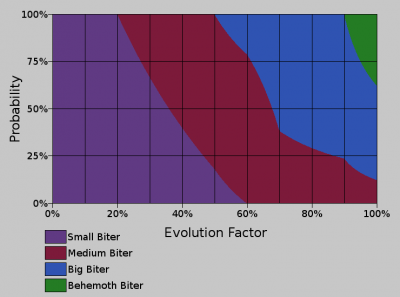
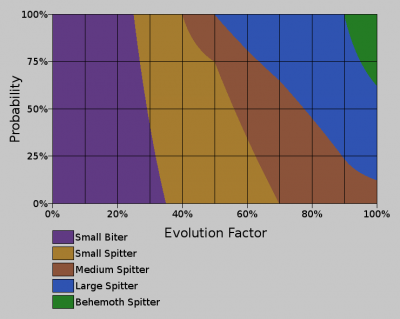
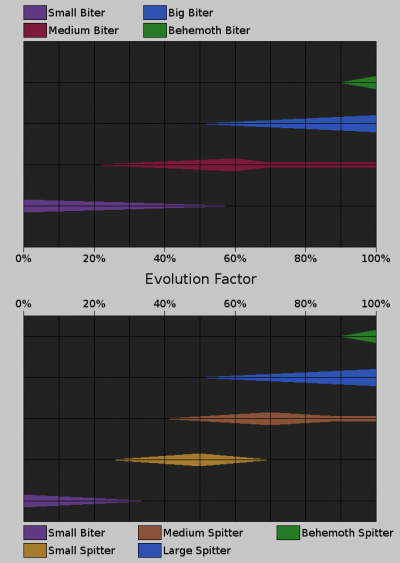
The probability charts show the chances of each type of biter/spitter for each spawner at all evolution levels.
Advanced: Evolution factor components and estimation
The section below has charts plotting the individual evolution factor components and discusses possibilities for manually estimating the evolution factor. (Click to expand.)
Notes
- All charts end at approximately an evolution factor of 0.99.
- To simplify calculation, the time and pollution charts are calculated using steps of 1,000 seconds / 1,000,000 pollution units - in both cases 1,000 times larger than the unit the game uses for the calculation. Because of the recursive nature of the calculation, this makes the values in the charts somewhat lower than those the game would obtain in the same calculation; however, the difference is fairly minimal (less than 1 percentage point). The spawners chart is calculated 1-to-1 and therefore accurate.
- While time passed is shown on save files and spawners destroyed can be retrieved from player statistics, the game does not currently report the total pollution released by the player. Also, none of the well-known Factorio calculators show pollution generated by a particular factory. Therefore, to make use of the pollution chart the player's pollution output would need to be manually estimated.
- Given that the game reports the actual evolution factor (console:
/evolution) whenever the player wishes, these charts are intended primarily to help estimate the impact of planned base expansions and similar activities on the evolution factor's future development.
Comments
These charts (click to enlarge) represent the situation where each evolution factor component (time, pollution, destroyed spawners) is the only component contributing to the evolution factor in that entire game. They are therefore not realistic, as in a typical game all three components will contribute, some at varying times and intensities.
Because of how contributions to the evolution factor (hereinafter, EF) are calculated (multiplied by (1 - current EF)), it is not possible to simply add the values indicated by these charts for a game's time passed, pollution generated, and / or spawners destroyed so far to retrieve the total evolution factor.
For example, if 20 hours have passed (single-component EF =~ 0.25), 10 million pollution units were released (single-component EF =~ 0.15), and 200 spawners were destroyed (single-component EF =~ 0.35), the actual evolution factor will not be (0.25 + 0.15 + 0.35 =) ~0.85.
However, the evolution factor will always be less than the sum of all individual components as indicated by these charts, and at least as high as the highest individual component. Thus, using the values from above, the EF will be at least 0.35 and less than 0.85. More detailed interpolation would require one to know exactly when individual spawners were destroyed and each 1,000th unit of pollution released, which is practically impossible to track.
Estimation of actual evolution factor
A very approximate way to estimate the actual EF would be to sum the values from the three charts as E[t] + E[p] * (1 - E[t]) + E[s] * [1 - E[t] - E[p] * (1 - E[t])], where E[t], E[p], and E[s] are the single-component values from the pollution, time, and spawner charts, in that order.
That is equivalent to assuming that first, all time passed, then, all pollution was released, then, all spawners were destroyed. While generally not true, it is at least a reasonable approximation given that usually, both pollution production and spawner destruction tend to increase as the game progresses and the player advances. Note that the result can both under- and overestimate the actual value, depending on the precise timing of pollution production and spawner destruction.
For the values from above, the estimate would return 0.25 + 0.15 * (1 - 0.25) + 0.35 * [1 - 0.25 - 0.15 * (1 - 0.25)] = 0.25 + 0.1125 + 0.223125 = 0.585625 =~ 0.60. Note that given the likely size of the error on such an estimate, rounding to the nearest 0.05 is unlikely to be a source of much further imprecision.
A similar method can be used to estimate impact of future player activities on the EF: Simply have the game print the current EF, then perform the estimate from the charts, as above, for future activities only, and multiply the estimate result by (1 - E[a]), where E(a) is the actual current EF returned by the game.
For example, if the player planned to spend the next 20 hours building up their base, releasing 10 million pollution and destroying 200 spawners in the meantime (i.e., the same numbers as in the example above), and the EF at the start of the project were, say, 0.55, then the estimated EF at project end would be 0.55 + (1 - 0.55) * 0.585625 = 0.55 + 0.26353125 = 0.81353125 =~ 0.80.
History
- 0.15.0:
- Increased the damage, range, and health of worms.
- Decreased health and resist of Behemoth biters.
- 0.13.10:
- Biters and other units won't become aggressive as a result of friendly-fire.
- 0.13.0:
- Big and behemoth enemies now spawn 50% slower.
- 0.12.26:
- Running biters over with a vehicle will now anger them in peaceful mode.
- 0.12.0:
- Updated sounds for enemies.
- 0.11.6:
- Range of spitters is now 15, less than turrets.
- 0.11.0:
- Spitters added.
- Drawing of enemies optimised, so adding new colors does not impact VRAM.
- Blood splashes on death are now procedural.
- 0.9.0:
- Turrets no longer search for enemies when none are near.
- Biters can no longer destroy the shipwreck in the 3rd new hope campaign.
- 0.8.1:
- Further improvement to enemy AI.
- 0.7.2:
- Biter AI improved.
- 0.7.1:
- Peaceful mode added for freeplay.
- 0.7.0:
- Enemy creepers were replaced by small, medium and big biters.
- Enemy turrets were replaced by small, medium and big shooting worms.
- Enemies move and attack in groups.
- Enemies wander around their base when they have nothing to do.
- Enemies call for help when attacked.
- Enemies can create new bases.
- Enemies can now destroy all player creations they find.
- 0.1.0:
- Introduced, called 'creepers'


