Production statistics: Difference between revisions
mNo edit summary |
mNo edit summary |
||
| Line 1: | Line 1: | ||
{{Languages}} | {{Languages}} | ||
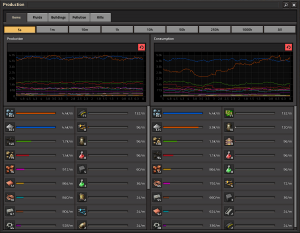
The '''production screen''' is a window that shows details about the rate at which your factory produces and consumes items. It also includes graphs to show how this information has changed over time. By default, it is accessed by pressing P in-game. | [[File:Production_Window.png|thumb|right|The production window in action.]]The '''production screen''' is a window that shows details about the rate at which your factory produces and consumes items. It also includes graphs to show how this information has changed over time. By default, it is accessed by pressing P in-game. | ||
== Timescales == | == Timescales == | ||
The timescale can be set to 5 seconds, 1 minute, 10 minutes, 1 hour, 10 hours, or 50 hours. If you are a new player, you might find the idea of playing a single factory for 50 hours ridiculous. You'll change your mind soon enough. | |||
== Production, Fluids and Buildings == | == Production, Fluids and Buildings == | ||
Revision as of 08:59, 12 April 2019

The production screen is a window that shows details about the rate at which your factory produces and consumes items. It also includes graphs to show how this information has changed over time. By default, it is accessed by pressing P in-game.
Timescales
The timescale can be set to 5 seconds, 1 minute, 10 minutes, 1 hour, 10 hours, or 50 hours. If you are a new player, you might find the idea of playing a single factory for 50 hours ridiculous. You'll change your mind soon enough.
Production, Fluids and Buildings
The default tab, production, shows how many of a given product have been produced and consumed through assemblers, chemical plants etc. These can be from all categories, including ore, electronic circuits and transport belts. The production screen offers two additional tabs. The fluids tab works similarly to the production tab in that it shows produced and consumed fluids. This includes steam that is created to generate power, but also all oil-related fluids. The buildings tab gives an overview over which buildings the player (by hand or by bot) has placed into the world and deconstructed recently. This includes assembly machines and transport belts, but also trees.
Filtering the graph
If some items are produced at a significantly higher rate than others (this often happens with iron and copper plates), the graphs get compressed vertically so they can fit in the space. This makes it very hard to see how production has changed over time for other items. To alleviate the issue, the player can filter which items are to be shown on the graph by clicking the icons of the resources. This changes from the default view (all items visible) to a view where only the selected items are visible. The player can add more items to the selection by clicking the resource icons. To return to the default view there is a button in the upper right part of the item list.
Limitations
- Only the items with the highest production and consumption rates are shown in the window. The number actually shown depends on your screen size.
- At low timescales, the rate shown can be inaccurate because of the small number of items sampled to get the value.