Tutorial:Diagnosing performance issues: Difference between revisions
No edit summary |
(Updated flip description with verified info) |
||
| Line 69: | Line 69: | ||
| Render (and sub-lines) || This is GPU-based work related to the rendering of the frame on your screen, costing FPS. This will increase if you zoom out or if you're looking at a particularly busy part of your factory. || - | | Render (and sub-lines) || This is GPU-based work related to the rendering of the frame on your screen, costing FPS. This will increase if you zoom out or if you're looking at a particularly busy part of your factory. || - | ||
|- | |- | ||
| Flip[On/Off] || This is the time spent waiting for the graphics driver to | | Flip[On/Off] || This is the time spent waiting for the graphics driver to finish rendering the frame into the back-buffer, swapping it with front-buffer and presenting it to the screen. The "On" or "Off" in square brackets indicates if Vsync is enabled or not. || Try toggling Vsync on or off. | ||
|- | |- | ||
| Sleep || When it took less than 16.667ms to prepare a tick, the game sleeps. This is normal and good. If this is above 0, then congrats, you have 60 UPS. || - | | Sleep || When it took less than 16.667ms to prepare a tick, the game sleeps. This is normal and good. If this is above 0, then congrats, you have 60 UPS. || - | ||
Revision as of 13:48, 22 January 2024
Too Long; Didn't Read
Open the show-time-usage screen. If you're having consistent low UPS, look for big numbers in the first column. If you're having stutters and freezes, look for big numbers in the third column.
Accessing the "time usage" screen
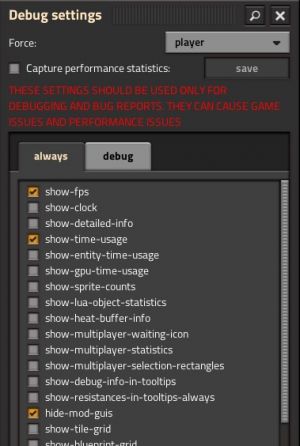
Press F4 to open the "Debug settings" menu. This will show you a variety of options. You need to enable 3 of them:
- show-fps: This will show your FPS and UPS counter in the top right of your screen.
- show-time-usage: This will show details of many systems of the game and how much they are impacting the performance of your game. The majority of this tutorial will be about how to decrypt this information.
- hide-mod-guis: Sometimes, windows and buttons from mods can hide the information from show-time-usage. This option hides them so we can read everything.
Tip: To read the numbers more easily, open your map and scroll to an area you haven't explored yet, so the information is on a black background.
For more info on debug options and the debug settings menu, check out Debug mode.
FPS vs UPS
The first thing to look at is your FPS/UPS counter in the top right.
- FPS stands for Frames Per Second and relates to the work your graphics card is doing to display the picture on your screen. If your FPS is low, your screen will update less frequently, but your game will continue at regular speed.
- UPS stands for Updates Per Second and relates to the calculations needed to advance the state of your world. If your UPS is low, your game will run in slow motion. Factorio always aims to have 60 FPS and UPS.
FPS can never be higher than UPS. Which leaves you with 2 cases:
- Low FPS, High UPS: Your problem is graphical. Go to Factorio's graphics settings and adjust some settings here. Upgrading your graphics card will help with this.
- Low FPS, Low UPS: Your problem is low UPS. Continue following this tutorial to figure out what could be the cause and where you can save some UPS.
Decrypting the "time usage" screen
How it works
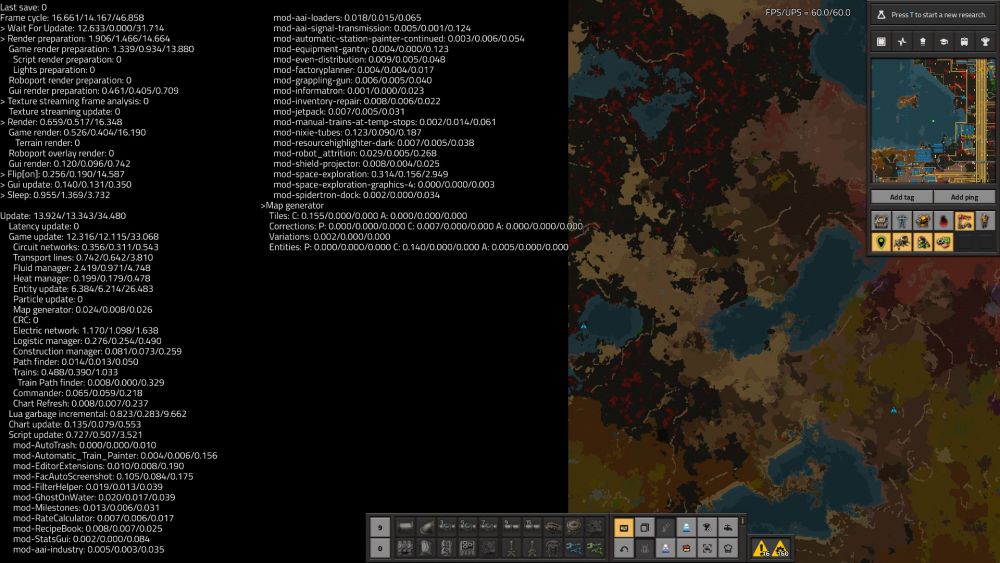
You should see a bunch of text and numbers like this:
Each line follows this format:
System name: average ms/minimum ms/maximum ms
Those numbers are in milliseconds per tick. A tick is one update step, it is for UPS what a "frame" is for FPS. Since Factorio aims for 60 ticks per second, the game has 16.667ms to calculate each tick. If it takes longer than this, then your UPS will drop below 60.
The 3 numbers for each line are the average time, minimum time, and maximum time taken by the system over the last 100 ticks.
This information is only telling you about the last 100 ticks, which is a little less than 2 seconds of gameplay. If your performance issues only happen some of the time or when you do something specific, you need to have the screen open while it is happening. If it happens too fast, you can take screenshots to read later. You can also use the "/perf-avg-frames 1000" command to increase the number of ticks considered to 1000 (or another number).
Now that you understand what this information is, look for large numbers. If you are experiencing consistent UPS issues, look at the average times. On the other hand, if you are experiencing occasional freezes or large stutters, look at the maximum times.
Remember, since 60 UPS is equivalent to 16.667ms per tick, you can think of it as 1ms of time costing you about 3.5 UPS. Anything above 1ms may be worth looking into, and anything above 5 is very significant.
When you've found some suspiciously large numbers, refer to the table below to see what the line means, whether you should worry about it, and how you can help:
Table of notable "time usage" lines
| Name | Explanation | How to solve |
|---|---|---|
| Last save | This is how long your last save took, and is not related to UPS | - |
| Frame cycle | This is the total time it took to render a frame. This can't ever be lower than 16.667ms. This doesn't give you any information that your UPS counter wouldn't tell you. | - |
| Wait For Update | This is the time your GPU waited for the world update. This should be roughly equal to the "Update" line below. Don't worry about it. | - |
| Render preparation (and sub-lines) | This is CPU-based work related to the rendering of the frame on your screen, costing UPS. This will increase if you zoom out or if you're looking at a particularly busy part of your factory. | - |
| Render (and sub-lines) | This is GPU-based work related to the rendering of the frame on your screen, costing FPS. This will increase if you zoom out or if you're looking at a particularly busy part of your factory. | - |
| Flip[On/Off] | This is the time spent waiting for the graphics driver to finish rendering the frame into the back-buffer, swapping it with front-buffer and presenting it to the screen. The "On" or "Off" in square brackets indicates if Vsync is enabled or not. | Try toggling Vsync on or off. |
| Sleep | When it took less than 16.667ms to prepare a tick, the game sleeps. This is normal and good. If this is above 0, then congrats, you have 60 UPS. | - |
| Update | This is where we get into the meat of things. The Update line is purely about the world tick and not about rendering the screen frame. This is usually where most of your frame time will be. | Look at the sub-lines to get more details. |
| Game update | The core systems of the game. | Look at the sub-lines to get more details. |
| Circuit networks | Self-explanatory. | Use fewer combinators and other circuit connections. |
| Transport lines | Related to belts. | Optimizing belt UPS is a dark art that is out of scope of this guide. |
| Fluid manager | Self-explanatory. | Reduce your amount of pipes. Use underground pipes (2 fluid entities) wherever they could replace 3 or more pipes. Replace nuclear power with solar power. |
| Heat manager | Self-explanatory. | Use less heat entities, for example by replacing nuclear power with solar power. |
| Entity manager | Related to "entities", which are a lot of things. This will usually be the largest number in your list. | To dig deeper into this, continue to the next part of the tutorial. |
| Electric networks | Self-explanatory. | This is particularly affected by the number of different electric networks, not their size. A single electric pole connected to nothing else is an electric network and is a performance cost. |
| Trains | Self-explanatory. | Use fewer but bigger trains. Use a train network optimized for UPS, which is also a dark art, out of scope of this guide. |
| Chart update | Related to refreshing chunks of your map, usually done by radars. | Reduce your number of radars. |
| Lua garbage incremental | This is related to mod scripts. | First, try and solve any issue in the "Script update" lines. If there is nothing there but you still have a high "Lua garbage incremental" cost, the show-lua-object-statistics debug option may help to find mods that create and destroy a lot of Lua objects. |
| Script update | The time taken to run mods' Lua scripts. Each "mod-XXX" sub-line is the cost to run the scripts of a particular mod. | Uninstall offending mods. If the performance is worse than expected, consider filing a bug with the mod's author. |
Hidden mod costs
A mod's line on the "Script update" section is not always the entirety of its cost! Mods can indirectly affect the time of core systems. For example, a mod that makes trains repath a lot might increase the Trains cost, and a mod that creates a lot of different electric networks would increase the Electric network cost.
Digging deeper with the "entity time usage" screen
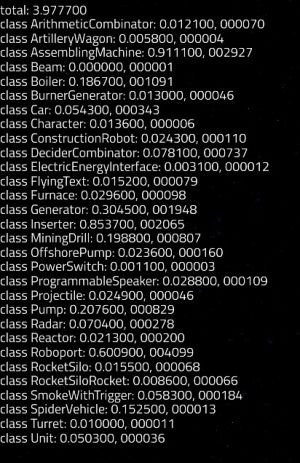
Return to the "Debug settings" menu, enable show-entity-time-usage and disable show-time-usage (It will get in the way).
On this screen, the "Entity manager" cost from the previous screen is split between each class of entity. The first number of each line is the time cost this tick, the second number is the number of active entities of this class.
Most lines are self explanatory, but a couple notes:
- AssemblingMachine: This isn't just assembling machines, but every building where you have to select a recipe (e.g. chemical plants, refineries, etc., but not furnaces). For this cost, the number of machines matters, not their speed. Fewer but faster machines (with beacons and modules) will cost less than many slow machines.
- Inserter: Use fewer inserters and have them work less often, e.g. with "inserter clocking".
- Unit: This is biters and spitters. Removing biters and spitters will remove this cost.
If you've ran out of things to optimize in this section, then you're just suffering from a factory that has grown bigger than your PC can handle. Congratulations!


