File:Inserter Efficiency Graph (Capacity Bonus 6) (Zoomed).png
_(Zoomed).png&diff=prev&oldid=213827)
_(Zoomed).png&direction=prev&oldid=213827)

Original file (1,650 × 1,250 pixels, file size: 57 KB, MIME type: image/png)
Graph showing efficiency of different inserters at different throughputs. This version has capacity bonus 6, and is zoomed in to the area of interest. Dots have been marked on the intersections.
Code to recreate if necessary
import matplotlib.pyplot as plt
import numpy as np
from mpl_toolkits.axes_grid1.inset_locator import zoomed_inset_axes
burner_speed = 60 / 76
yellow_speed = 60 / 70
red_speed = 60 / 50
blue_speed = 60 / 24
yellow_drain = 0.4
blue_drain = 0.5
green_drain = 1
burner_energy = 66.9
yellow_energy = 6.65
red_energy = 7
blue_energy = 8.12
green_energy = 23.2
stack_energy = 46.4
stack_size = 2
green_stack = 10
stack_stack = 14
x = np.linspace(0, blue_speed * stack_stack, 300)
yellow_count = np.trunc(x / (yellow_speed * stack_size)) + 1
red_count = np.trunc(x / (red_speed * stack_size)) + 1
blue_count = np.trunc(x / (blue_speed * stack_size)) + 1
green_count = np.trunc(x / (blue_speed * green_stack)) + 1
dynamic_stack = x / stack_size
dynamic_green = x / green_stack
dynamic_stacker = x / stack_stack
burner = burner_energy * dynamic_stack
yellow = (yellow_energy * dynamic_stack) + (yellow_drain * yellow_count)
red = (red_energy * dynamic_stack) + (yellow_drain * red_count)
blue = (blue_energy * dynamic_stack) + (blue_drain * blue_count)
green = (green_energy * dynamic_green) + (green_drain * green_count)
stack = (stack_energy * dynamic_stacker) + green_drain
fig = plt.figure(figsize = (20, 15))
ax = plt.axes()
ax.plot(x, burner, label = "Burner", color = "black")
ax.plot(x, yellow, label = "Yellow", color = "orange")
ax.plot(x, red, label = "Red", color = "red")
ax.plot(x, blue, label = "Blue", color = "blue")
ax.plot(x, green, label = "Green", color = "green")
ax.plot(x, stack, label = "Stack", color = "purple")
xlim = 5
ylim = 20
ax.set_ylim(0, ylim)
ax.set_xlim(0, xlim)
xtick = 0.1
ytick = 0.5
ax.set_xticks(np.arange(0, xlim + xtick, xtick))
ax.set_yticks(np.arange(0, ylim + ytick, ytick))
ax.set_title("Inserter Efficiency (Capacity Bonus 6) [Zoomed]")
ax.set_xlabel("Items / second", fontweight = "bold")
ax.set_ylabel("Power Cost (kW)", fontweight = "bold")
ax.grid()
ax.legend(loc = 4)
intersect1 = np.argwhere(np.diff(np.sign(green - blue))).flatten()
plt.plot(x[intersect1], green[intersect1] , 'ro')
intersect2 = np.argwhere(np.diff(np.sign(green - red))).flatten()
plt.plot(x[intersect2], green[intersect2] , 'ro')
intersect3 = np.argwhere(np.diff(np.sign(green - yellow))).flatten()
plt.plot(x[intersect3], green[intersect3] , 'ro')
intersect4 = np.argwhere(np.diff(np.sign(stack - blue))).flatten()
plt.plot(x[intersect4], stack[intersect4] , 'ro')
intersect5 = np.argwhere(np.diff(np.sign(stack - red))).flatten()
plt.plot(x[intersect5], stack[intersect5] , 'ro')
intersect6 = np.argwhere(np.diff(np.sign(stack - yellow))).flatten()
plt.plot(x[intersect6], stack[intersect6] , 'ro')
plt.show()
File history
Click on a date/time to view the file as it appeared at that time.
| Date/Time | Thumbnail | Dimensions | User | Comment | |
|---|---|---|---|---|---|
| current | 06:07, 6 May 2025 | | 1,650 × 1,250 (57 KB) | Cardinal (talk | contribs) | Size formatted, higher compression ratio. |
| 05:38, 26 April 2025 | 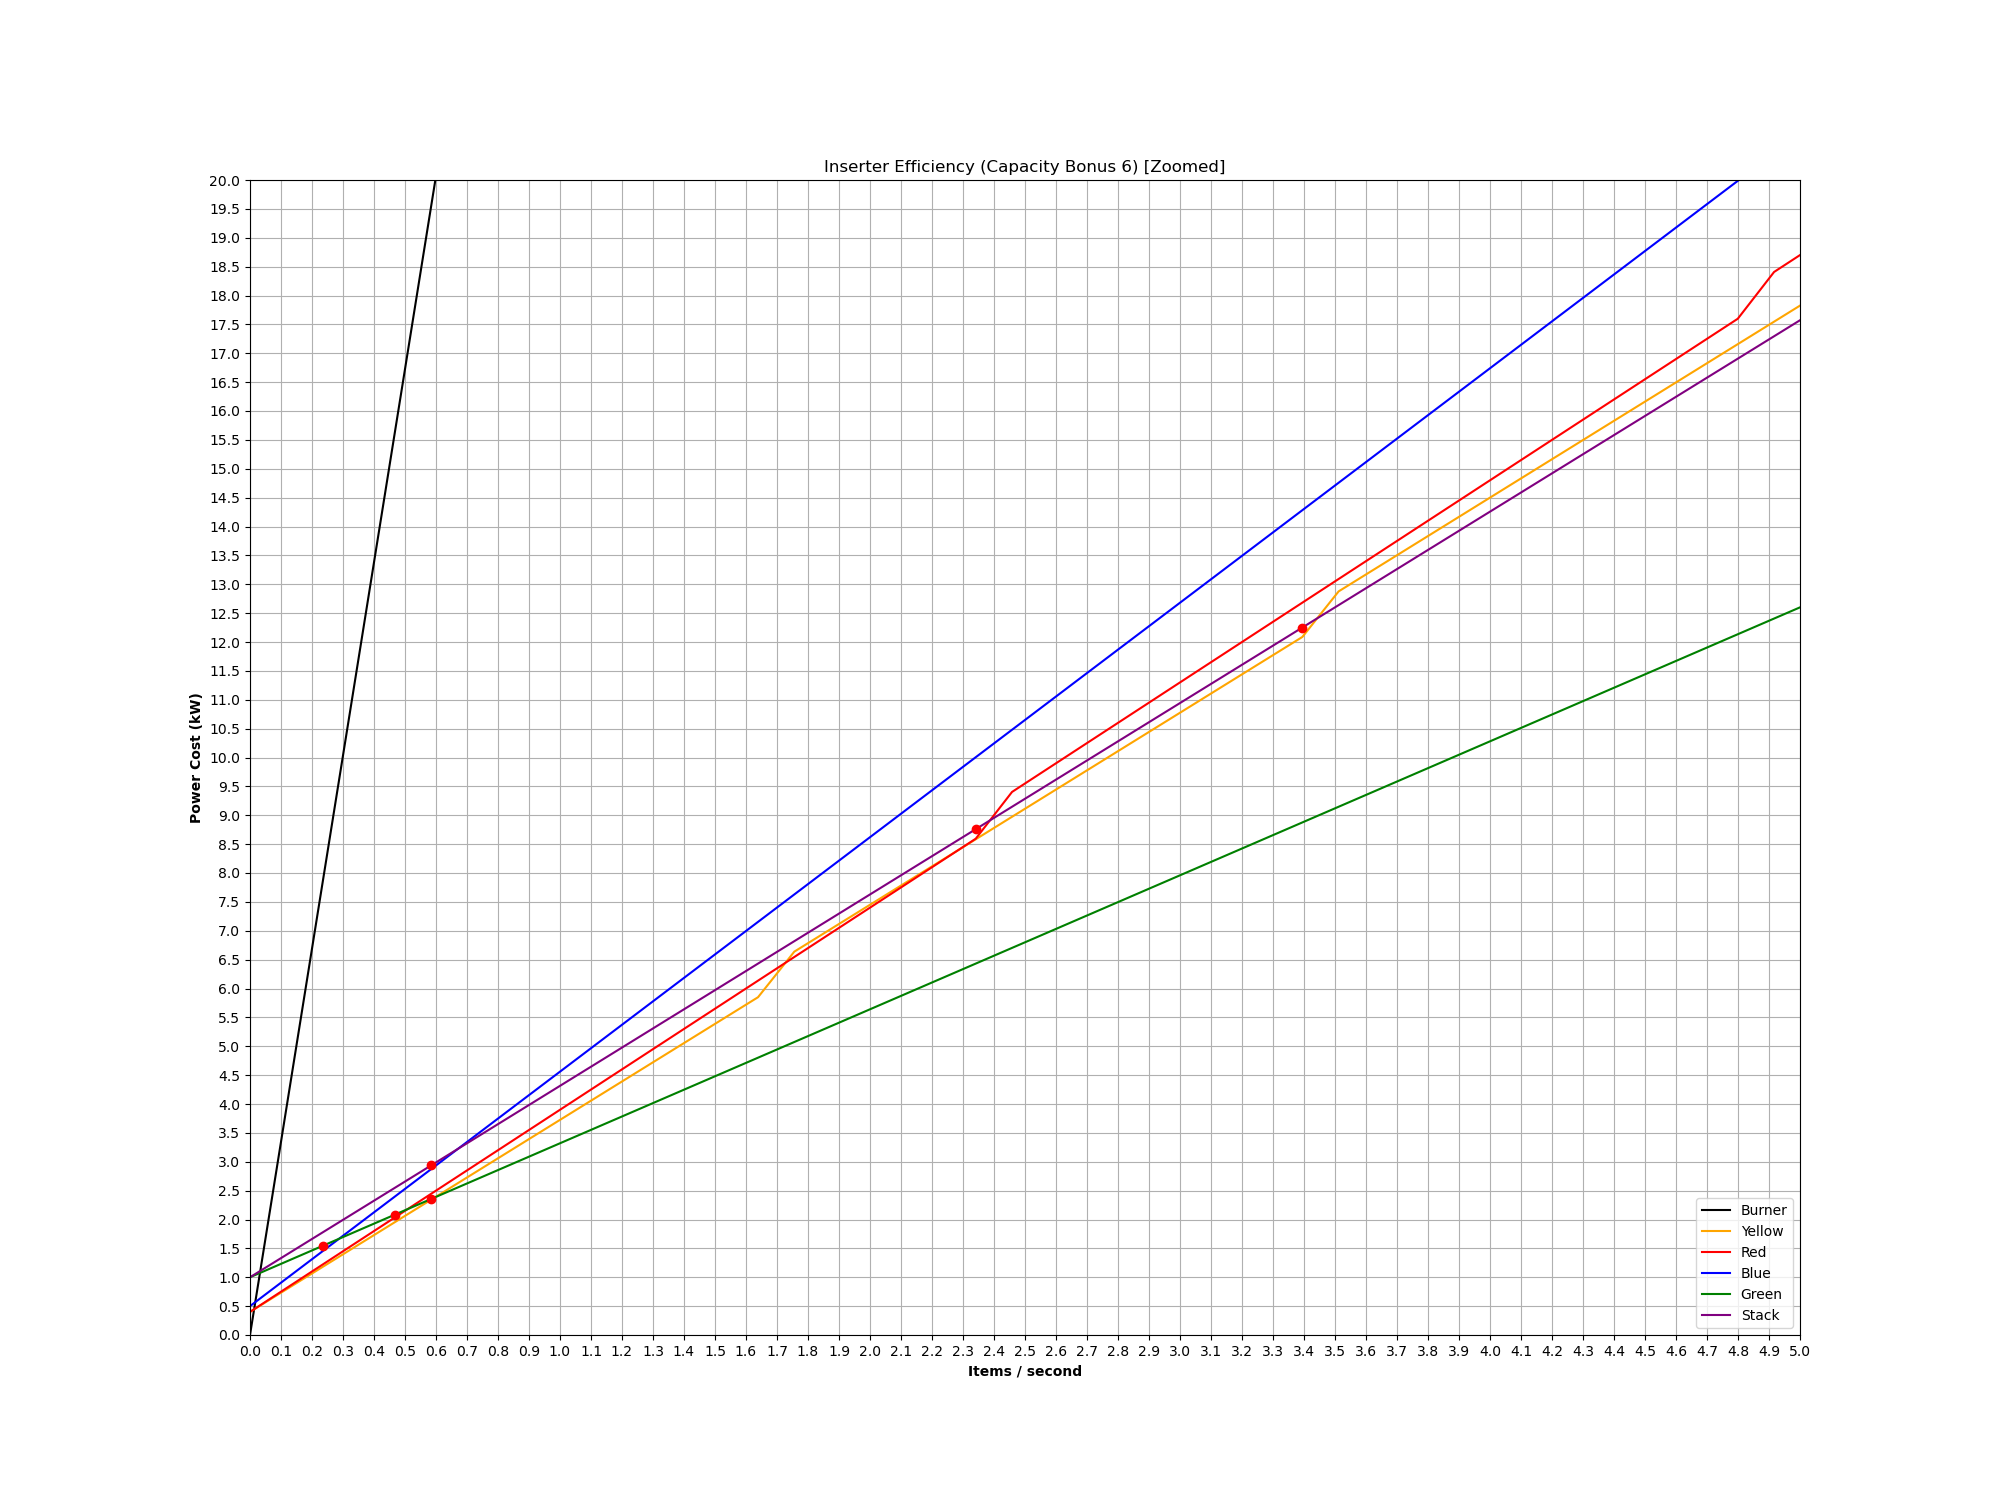 | 2,000 × 1,500 (199 KB) | GregFirehawk (talk | contribs) | Added Stack Inserter, fixed error, added dots at intersections | |
| 13:34, 9 January 2025 | 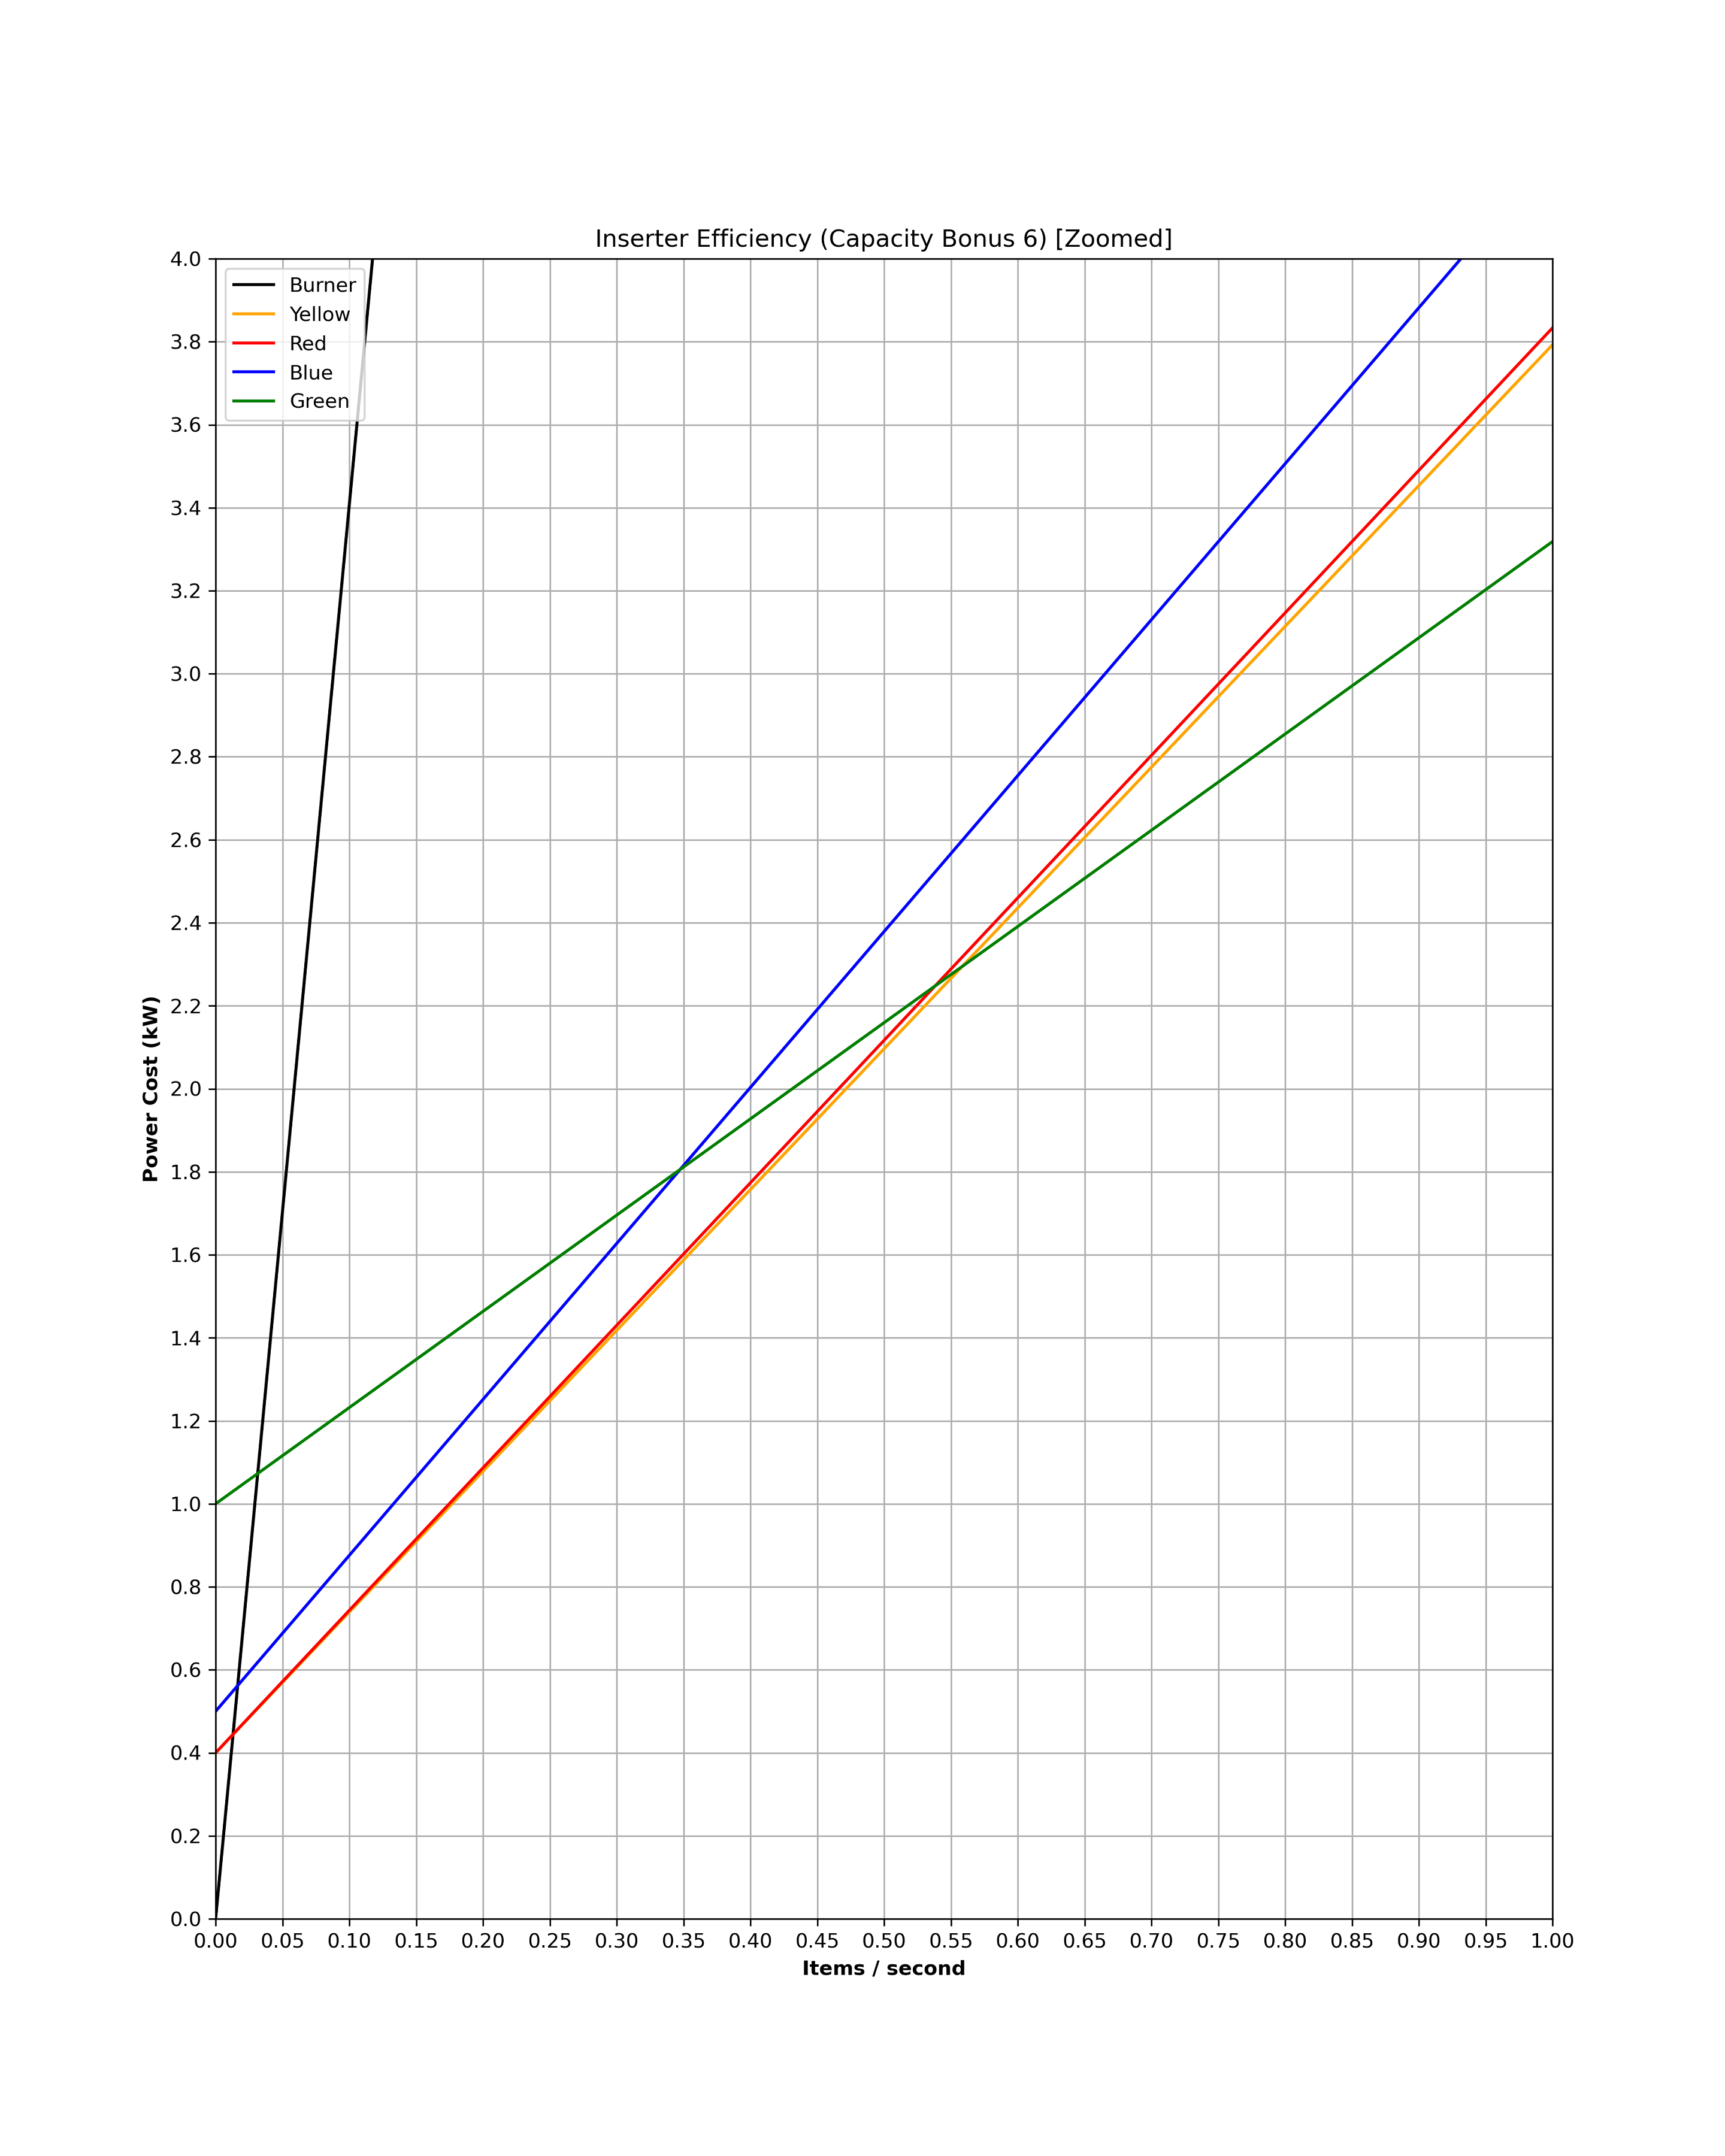 | 2,880 × 3,600 (410 KB) | GregFirehawk (talk | contribs) |
You cannot overwrite this file.
File usage
The following 2 pages use this file:
_(Zoomed).png&oldid=213827)