File:Burner Efficiency Graph (No Capacity Bonus).png
.png)
.png&diff=prev&oldid=213748)
.png&direction=prev&oldid=213748)
.png&diff=cur&oldid=213748)
.png&direction=next&oldid=213748)
.png&diff=next&oldid=213748)
Original file (1,650 × 1,250 pixels, file size: 60 KB, MIME type: image/png)
As described
Code if needed
import matplotlib.pyplot as plt
import numpy as np
from mpl_toolkits.axes_grid1.inset_locator import zoomed_inset_axes
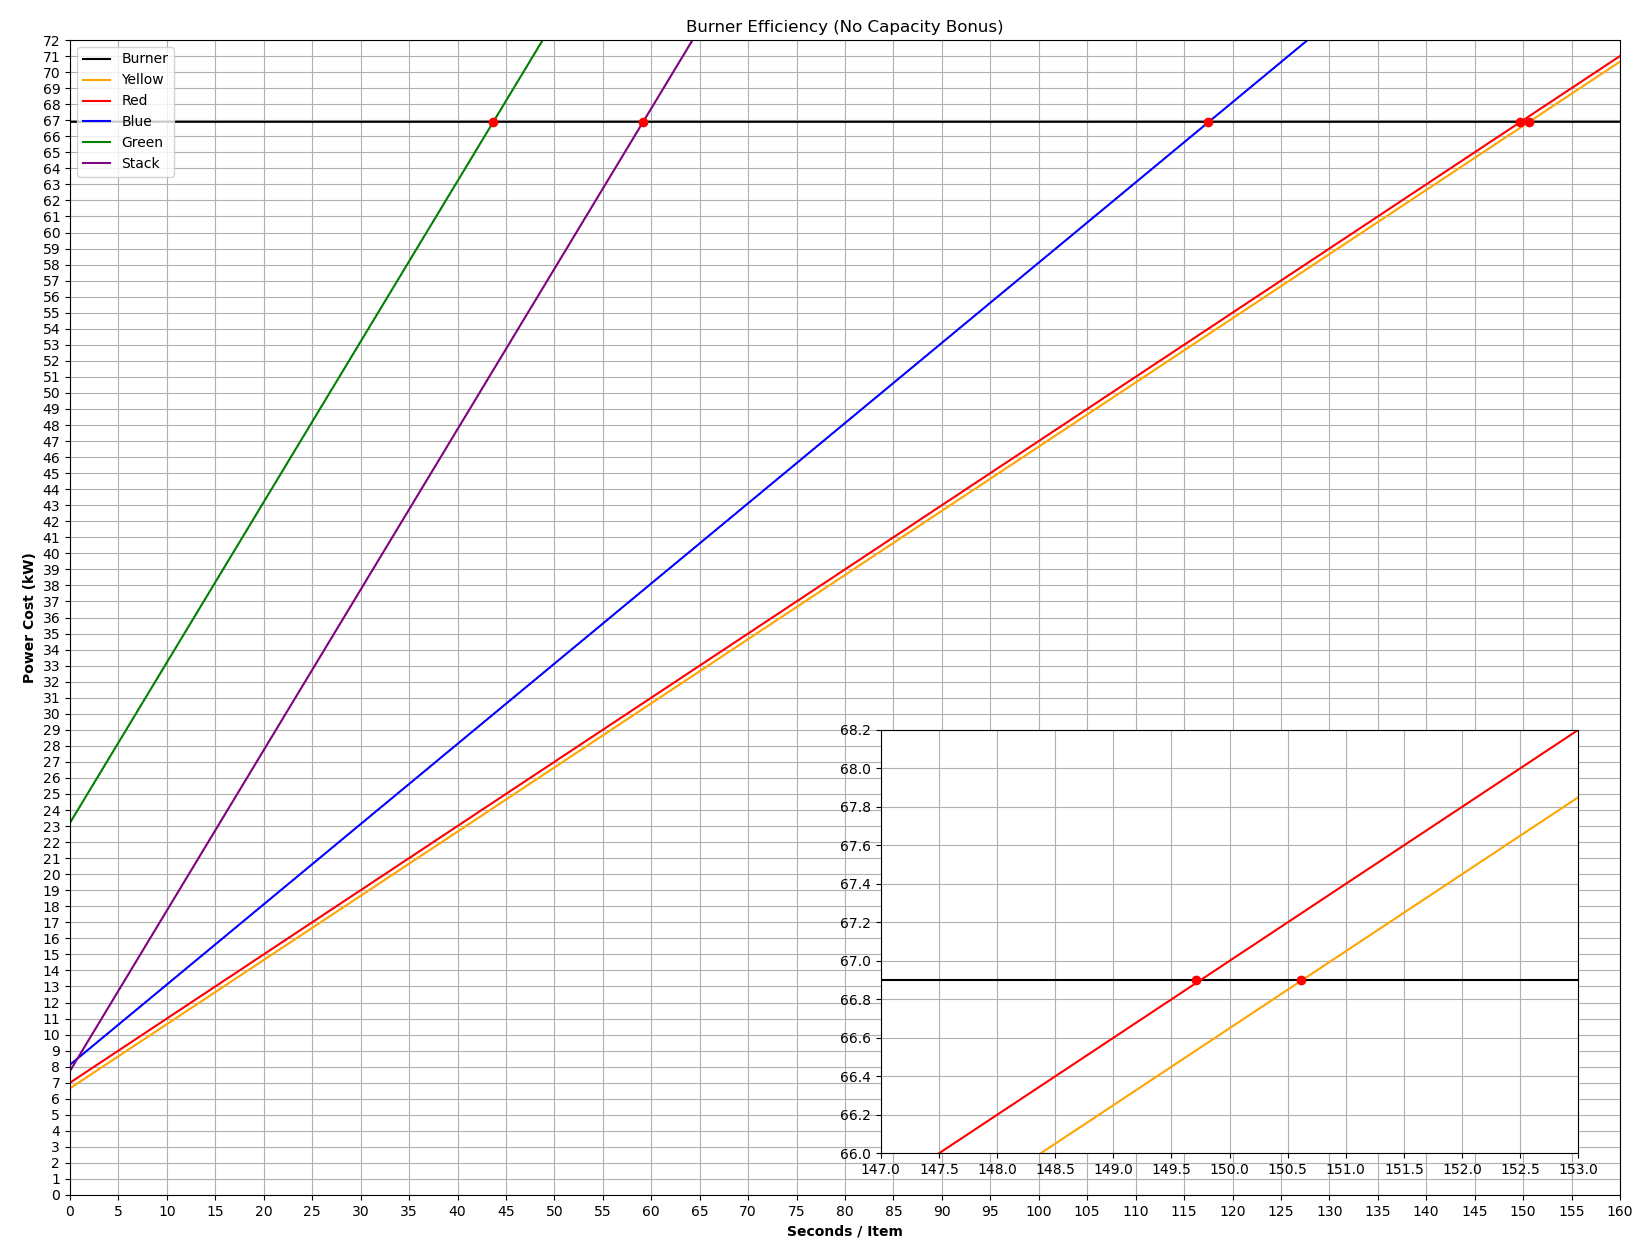
yellow_drain = 0.4
blue_drain = 0.5
green_drain = 1
burner_energy = 66.9
yellow_energy = 6.65
red_energy = 7
blue_energy = 8.12
green_energy = 23.2
stack_energy = 46.4
stack_stack = 6
x = np.linspace(0, 500, 10000)
burner = burner_energy + x - x
yellow = (yellow_drain * x) + yellow_energy
red = (yellow_drain * x) + red_energy
blue = (blue_drain * x) + blue_energy
green = (green_drain * x) + green_energy
stack = (green_drain * x) + (stack_energy / stack_stack)
fig = plt.figure(figsize = (20, 15))
ax = plt.axes()
ax.plot(x, burner, label = "Burner", color = "black")
ax.plot(x, yellow, label = "Yellow", color = "orange")
ax.plot(x, red, label = "Red", color = "red")
ax.plot(x, blue, label = "Blue", color = "blue")
ax.plot(x, green, label = "Green", color = "green")
ax.plot(x, stack, label = "Stack", color = "purple")
xlim = 160
ylim = burner_energy + 5
ax.set_ylim(0, ylim)
ax.set_xlim(0, xlim)
xtick = 5
ytick = 1
ax.set_xticks(np.arange(0, xlim + xtick, xtick))
ax.set_yticks(np.arange(0, ylim + ytick, ytick))
ax.set_title("Burner Efficiency (No Capacity Bonus)")
ax.set_xlabel("Seconds / Item", fontweight = "bold")
ax.set_ylabel("Power Cost (kW)", fontweight = "bold")
ax.grid()
ax.legend(loc = 2)
intersect1 = np.argwhere(np.diff(np.sign(burner - yellow))).flatten()
plt.plot(x[intersect1], burner[intersect1] , 'ro')
intersect2 = np.argwhere(np.diff(np.sign(burner - red))).flatten()
plt.plot(x[intersect2], burner[intersect2] , 'ro')
intersect3 = np.argwhere(np.diff(np.sign(burner - blue))).flatten()
plt.plot(x[intersect3], burner[intersect3] , 'ro')
intersect4 = np.argwhere(np.diff(np.sign(burner - green))).flatten()
plt.plot(x[intersect4], burner[intersect4] , 'ro')
intersect5 = np.argwhere(np.diff(np.sign(burner - stack))).flatten()
plt.plot(x[intersect5], burner[intersect5] , 'ro')
zax = zoomed_inset_axes(ax, 12, loc = 4, borderpad = 3)
zax.plot(x, burner, label = "Burner", color = "black")
zax.plot(x, yellow, label = "Yellow", color = "orange")
zax.plot(x, red, label = "Red", color = "red")
zax.plot(x, blue, label = "Blue", color = "blue")
zax.plot(x, green, label = "Green", color = "green")
zax.plot(x, stack, label = "Stack", color = "purple")
zxlim = 153
zylim = 68
zxinit = 147
zyinit = 66
zax.set_xlim(zxinit, zxlim)
zax.set_ylim(zyinit, zylim)
zxtick = 0.5
zytick = 0.2
zax.set_xticks(np.arange(zxinit, zxlim + zxtick, zxtick))
zax.set_yticks(np.arange(zyinit, zylim + zytick, zytick))
zax.grid()
plt.plot(x[intersect1], burner[intersect1] , 'ro')
plt.plot(x[intersect2], burner[intersect2] , 'ro')
plt.show()
File history
Click on a date/time to view the file as it appeared at that time.
| Date/Time | Thumbnail | Dimensions | User | Comment | |
|---|---|---|---|---|---|
| current | 06:13, 6 May 2025 | | 1,650 × 1,250 (60 KB) | Cardinal (talk | contribs) | Size formatted, higher compression ratio. |
| 07:54, 26 April 2025 | 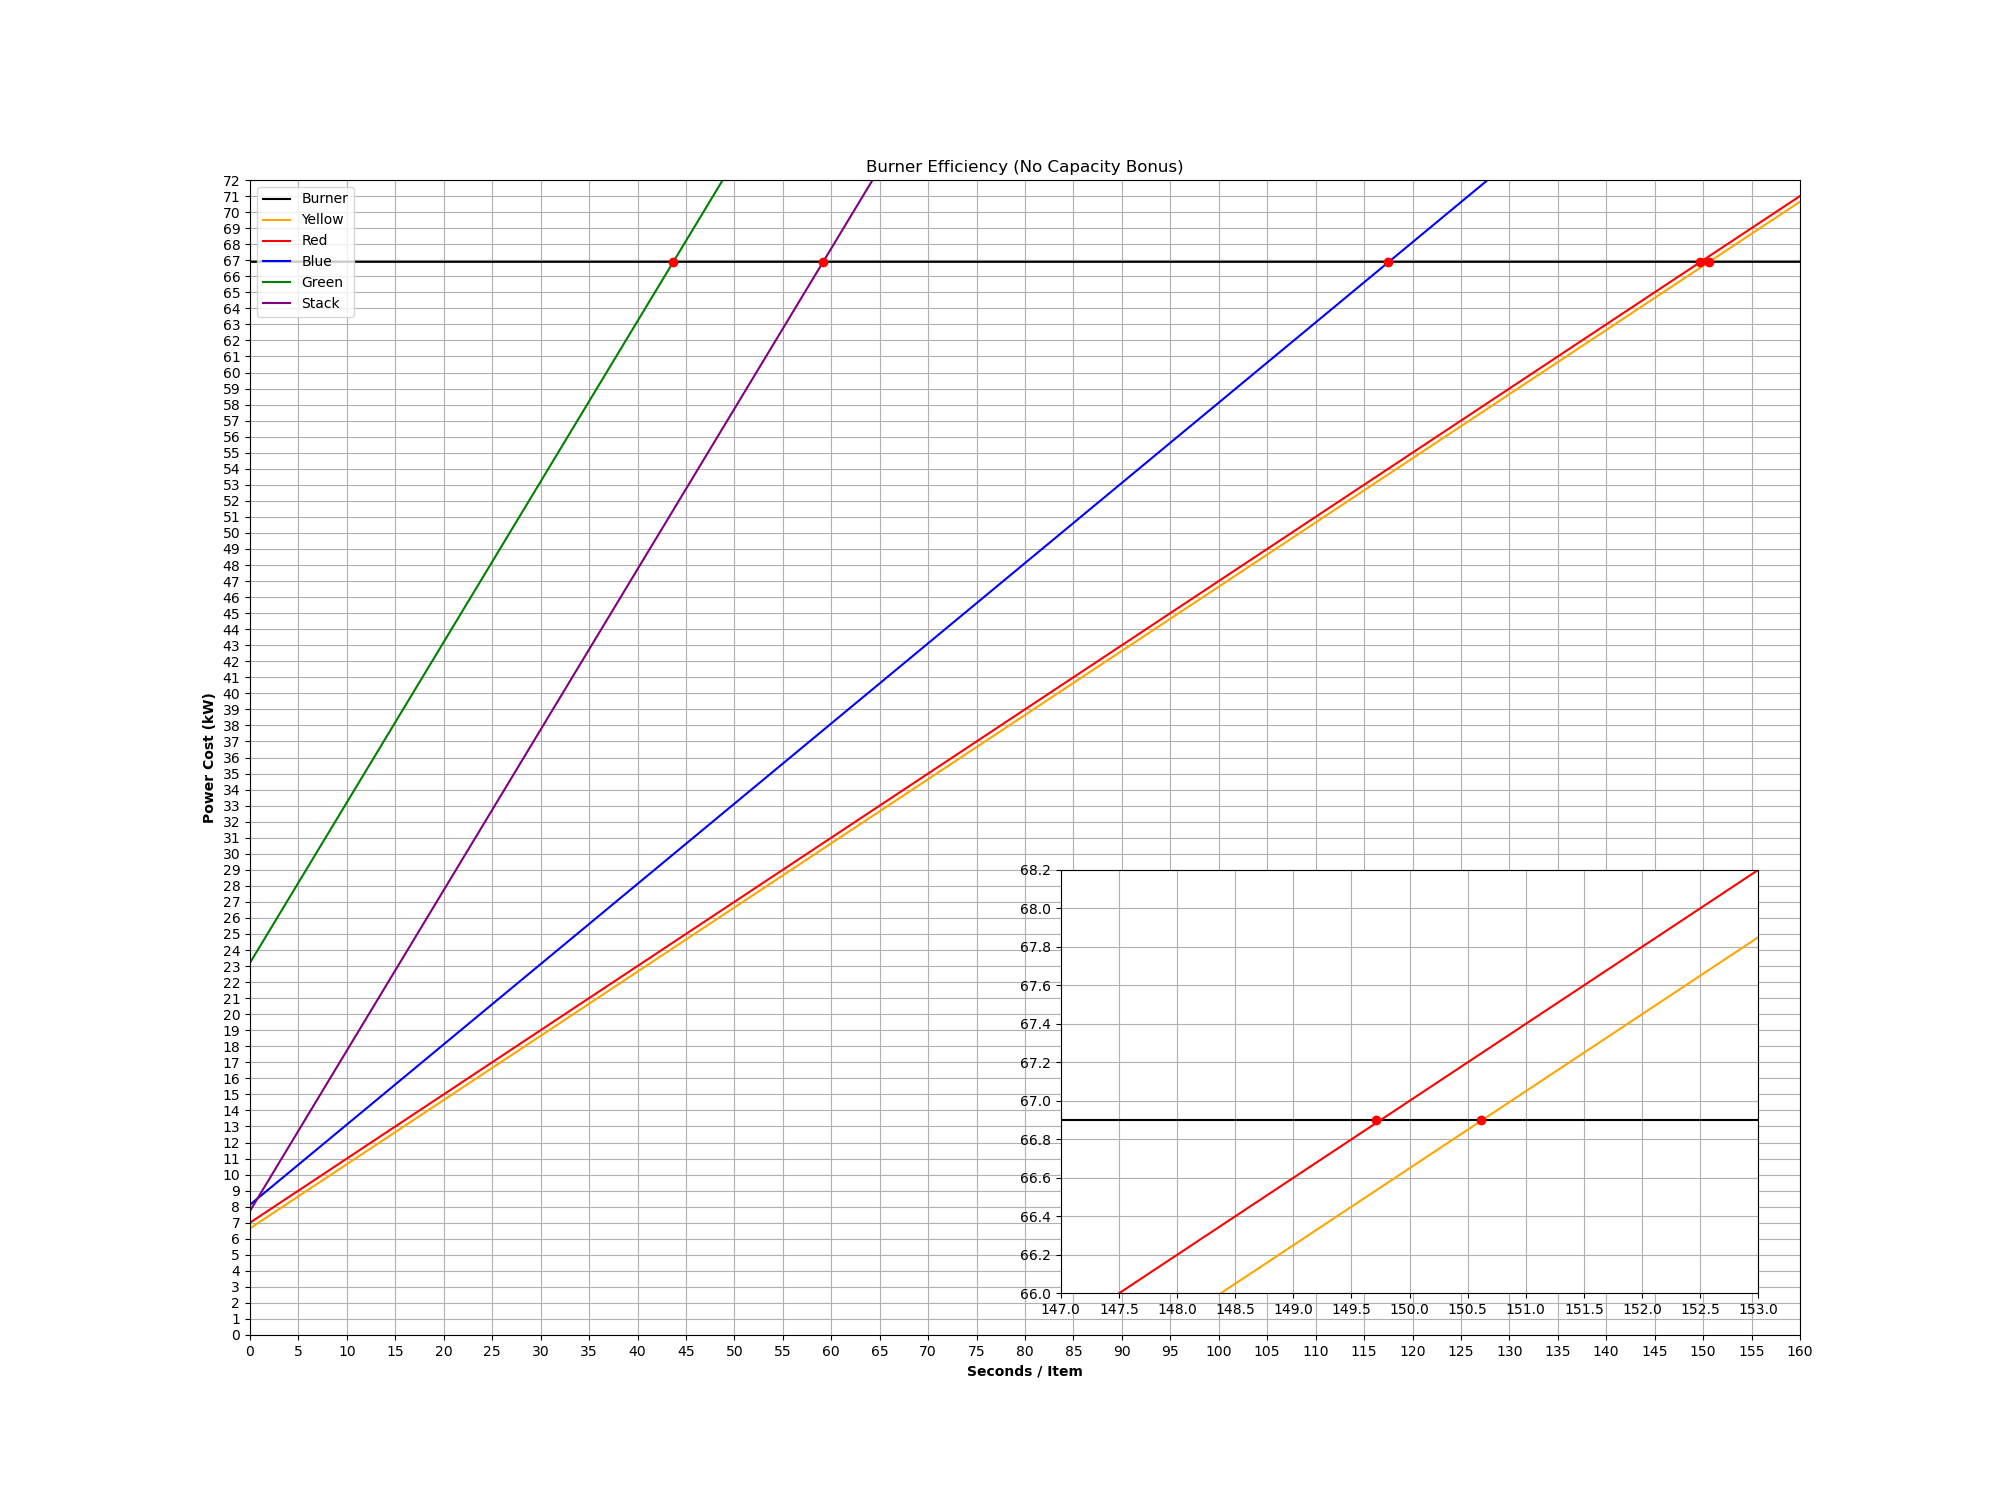 | 2,000 × 1,500 (226 KB) | GregFirehawk (talk | contribs) |
You cannot overwrite this file.
File usage
The following 2 pages use this file:
.png&oldid=213748)