File:Inserter Efficiency Graph (Capacity Bonus 4).png
.png)
.png&diff=prev&oldid=213553)
.png&direction=prev&oldid=213553)
.png&diff=cur&oldid=213553)
.png&direction=next&oldid=213553)
.png&diff=next&oldid=213553)
Original file (1,650 × 1,250 pixels, file size: 68 KB, MIME type: image/png)
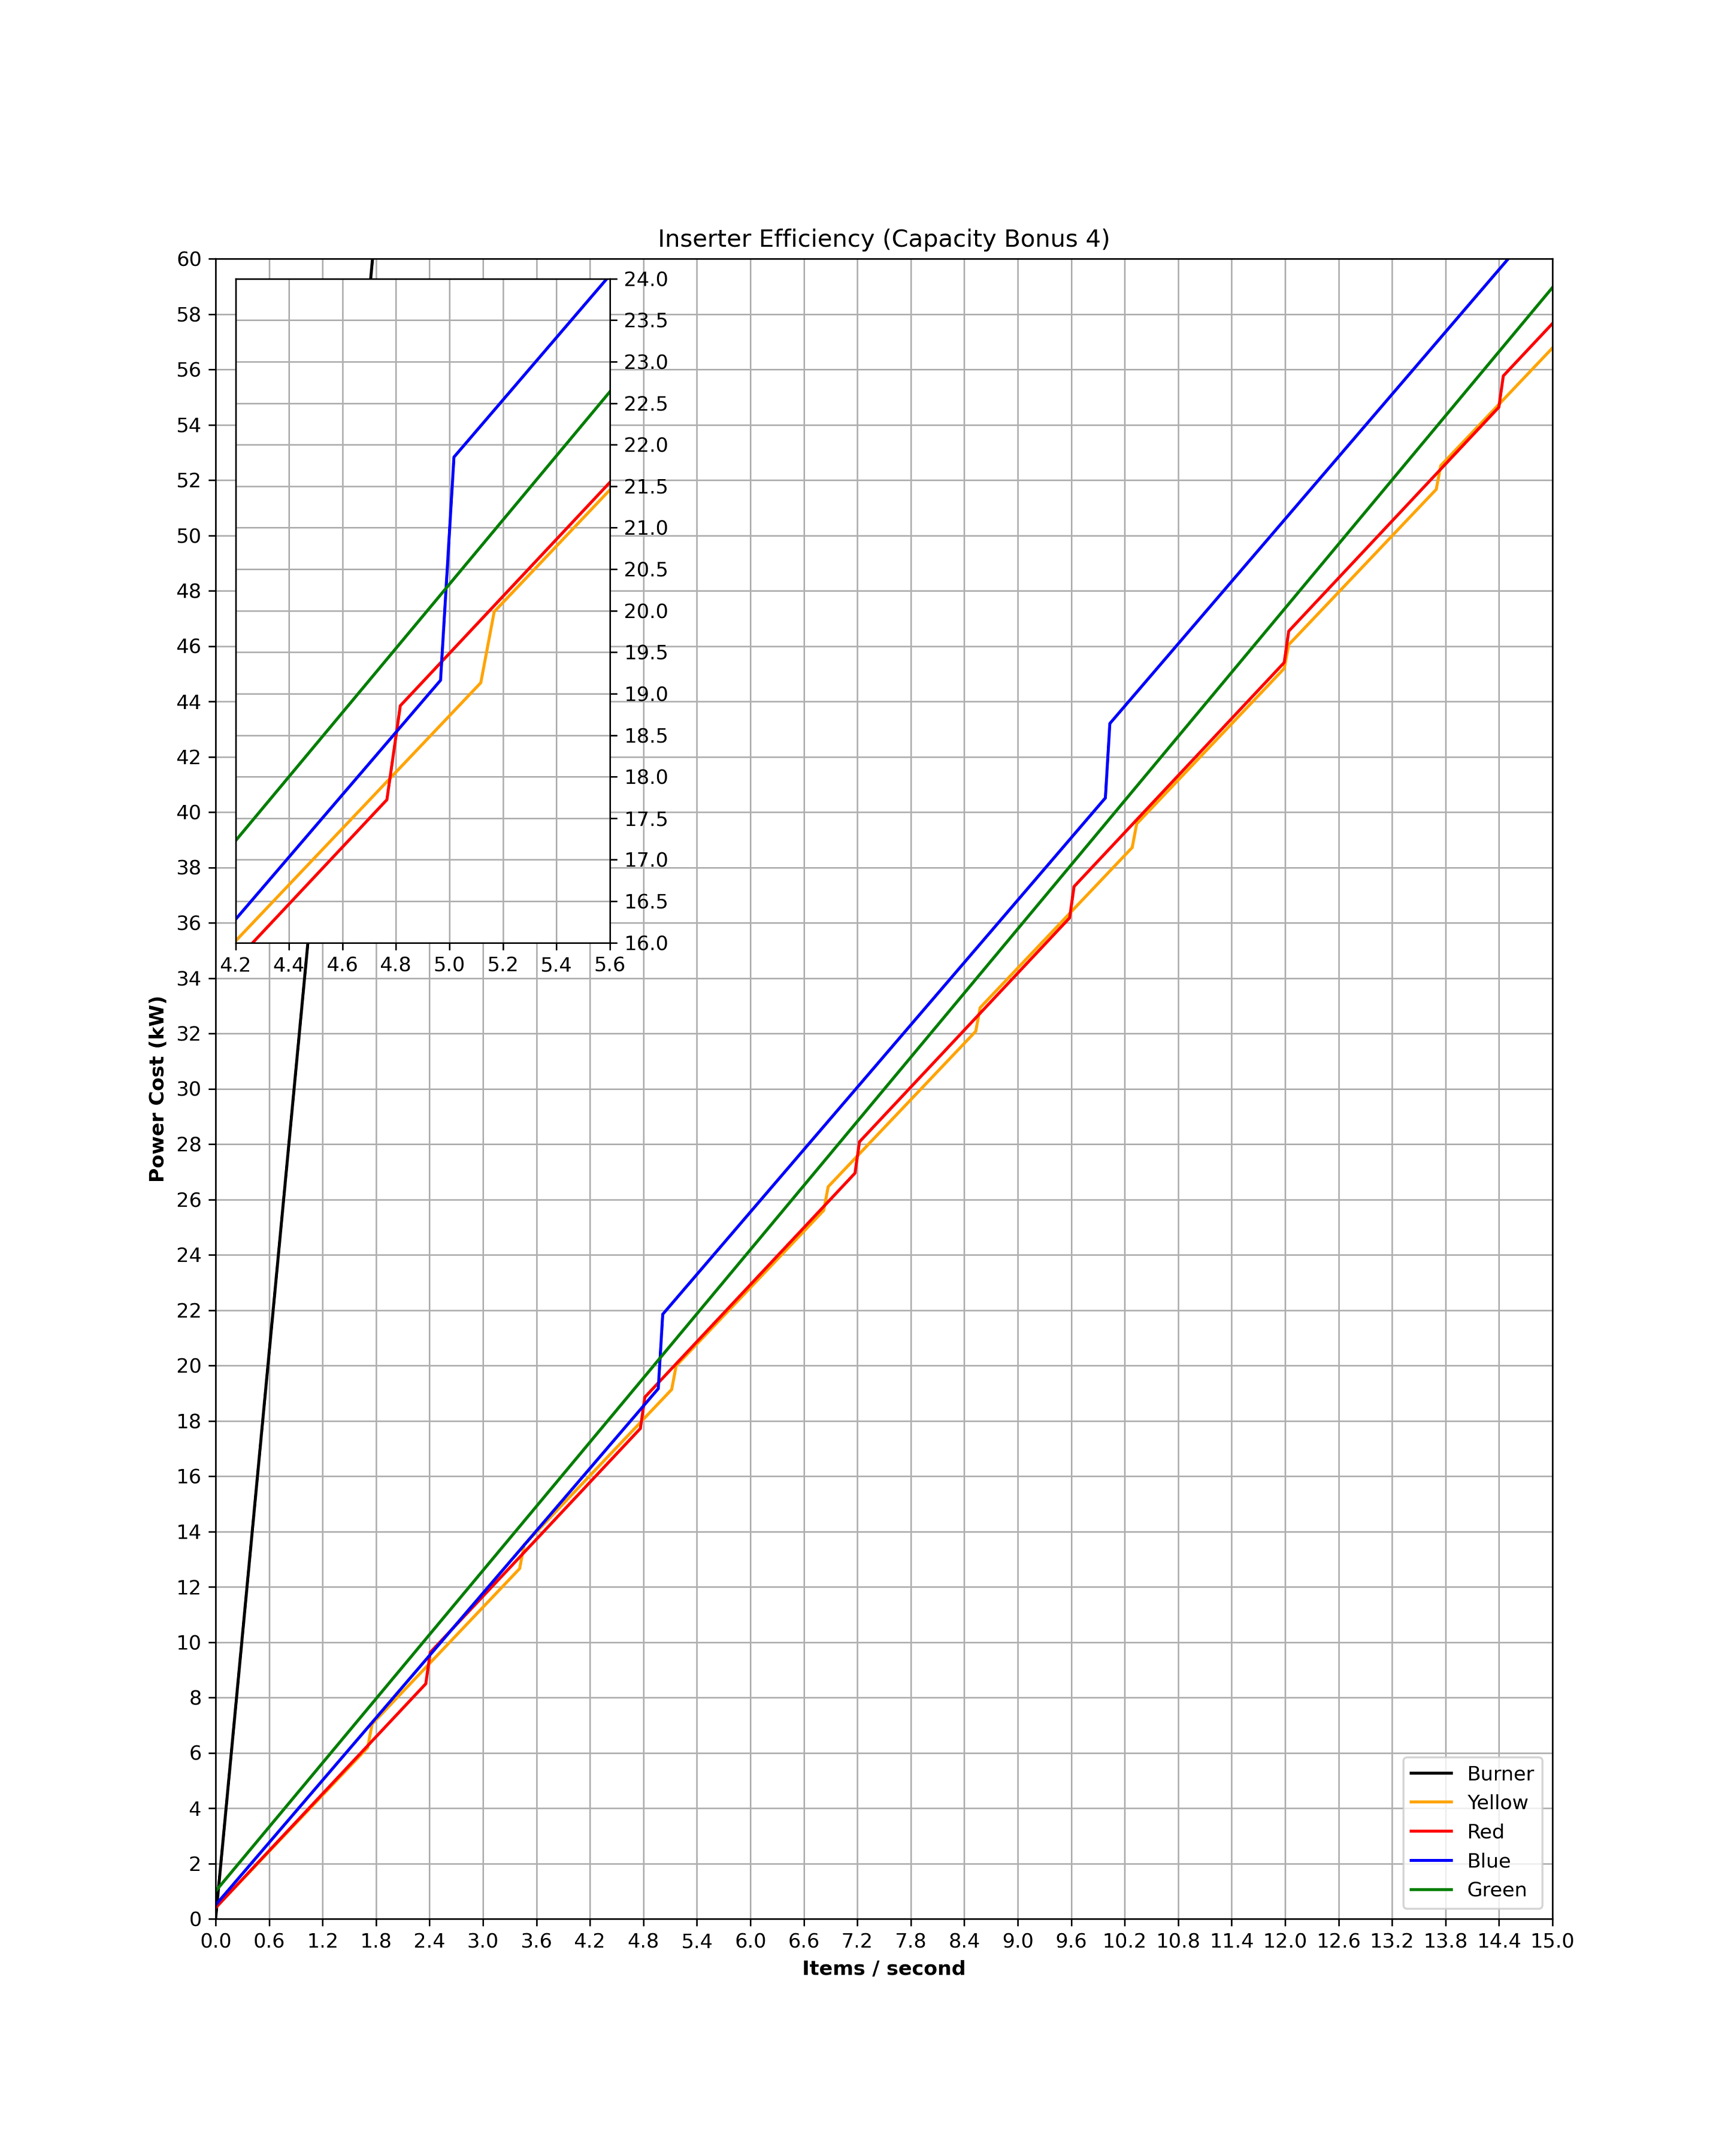
Graph showing efficiency of different inserters at different throughputs. This version has capacity bonus 4. Worth noting is the significant overlap between stack inserters and green inserters.
Here is the code to reproduce the graph in python if it ever needs editing:
import matplotlib.pyplot as plt
import numpy as np
burner_speed = 60 / 76
yellow_speed = 60 / 70
red_speed = 60 / 50
blue_speed = 60 / 24
yellow_drain = 0.4
blue_drain = 0.5
green_drain = 1
burner_energy = 66.9
yellow_energy = 6.65
red_energy = 7
blue_energy = 8.12
green_energy = 23.2
stack_energy = 46.4
stack_size = 2
green_stack = 4
stack_stack = 8
x = np.linspace(0, blue_speed * stack_stack, 300)
yellow_count = np.trunc(x / (yellow_speed * stack_size)) + 1
red_count = np.trunc(x / (red_speed * stack_size)) + 1
blue_count = np.trunc(x / (blue_speed * stack_size)) + 1
green_count = np.trunc(x / (blue_speed * green_stack)) + 1
dynamic_stack = x / stack_size
dynamic_green = x / green_stack
dynamic_stacker = x / stack_stack
burner = burner_energy * dynamic_stack
yellow = (yellow_energy * dynamic_stack) + (yellow_drain * yellow_count)
red = (red_energy * dynamic_stack) + (yellow_drain * red_count)
blue = (blue_energy * dynamic_stack) + (blue_drain * blue_count)
green = (green_energy * dynamic_green) + (green_drain * green_count)
stack = (stack_energy * dynamic_stacker) + green_drain
fig = plt.figure(figsize = (20, 15))
ax = plt.axes()
ax.plot(x, burner, label = "Burner", color = "black")
ax.plot(x, yellow, label = "Yellow", color = "orange")
ax.plot(x, red, label = "Red", color = "red")
ax.plot(x, blue, label = "Blue", color = "blue")
ax.plot(x, green, label = "Green", color = "green")
ax.plot(x, stack, label = "Stack", color = "purple")
xlim = blue_speed * stack_stack
ylim = (stack_energy / stack_stack) * xlim
ax.set_ylim(0, ylim)
ax.set_xlim(0, xlim)
xtick = 0.5
ytick = 2
ax.set_xticks(np.arange(0, xlim + xtick, xtick))
ax.set_yticks(np.arange(0, ylim + ytick, ytick))
ax.set_title("Inserter Efficiency (Capacity Bonus 2)")
ax.set_xlabel("Items / second", fontweight = "bold")
ax.set_ylabel("Power Cost (kW)", fontweight = "bold")
ax.grid()
ax.legend(loc = "best")
plt.show()
File history
Click on a date/time to view the file as it appeared at that time.
| Date/Time | Thumbnail | Dimensions | User | Comment | |
|---|---|---|---|---|---|
| current | 06:06, 6 May 2025 | | 1,650 × 1,250 (68 KB) | Cardinal (talk | contribs) | Size formatted, higher compression ratio. |
| 05:15, 26 April 2025 | 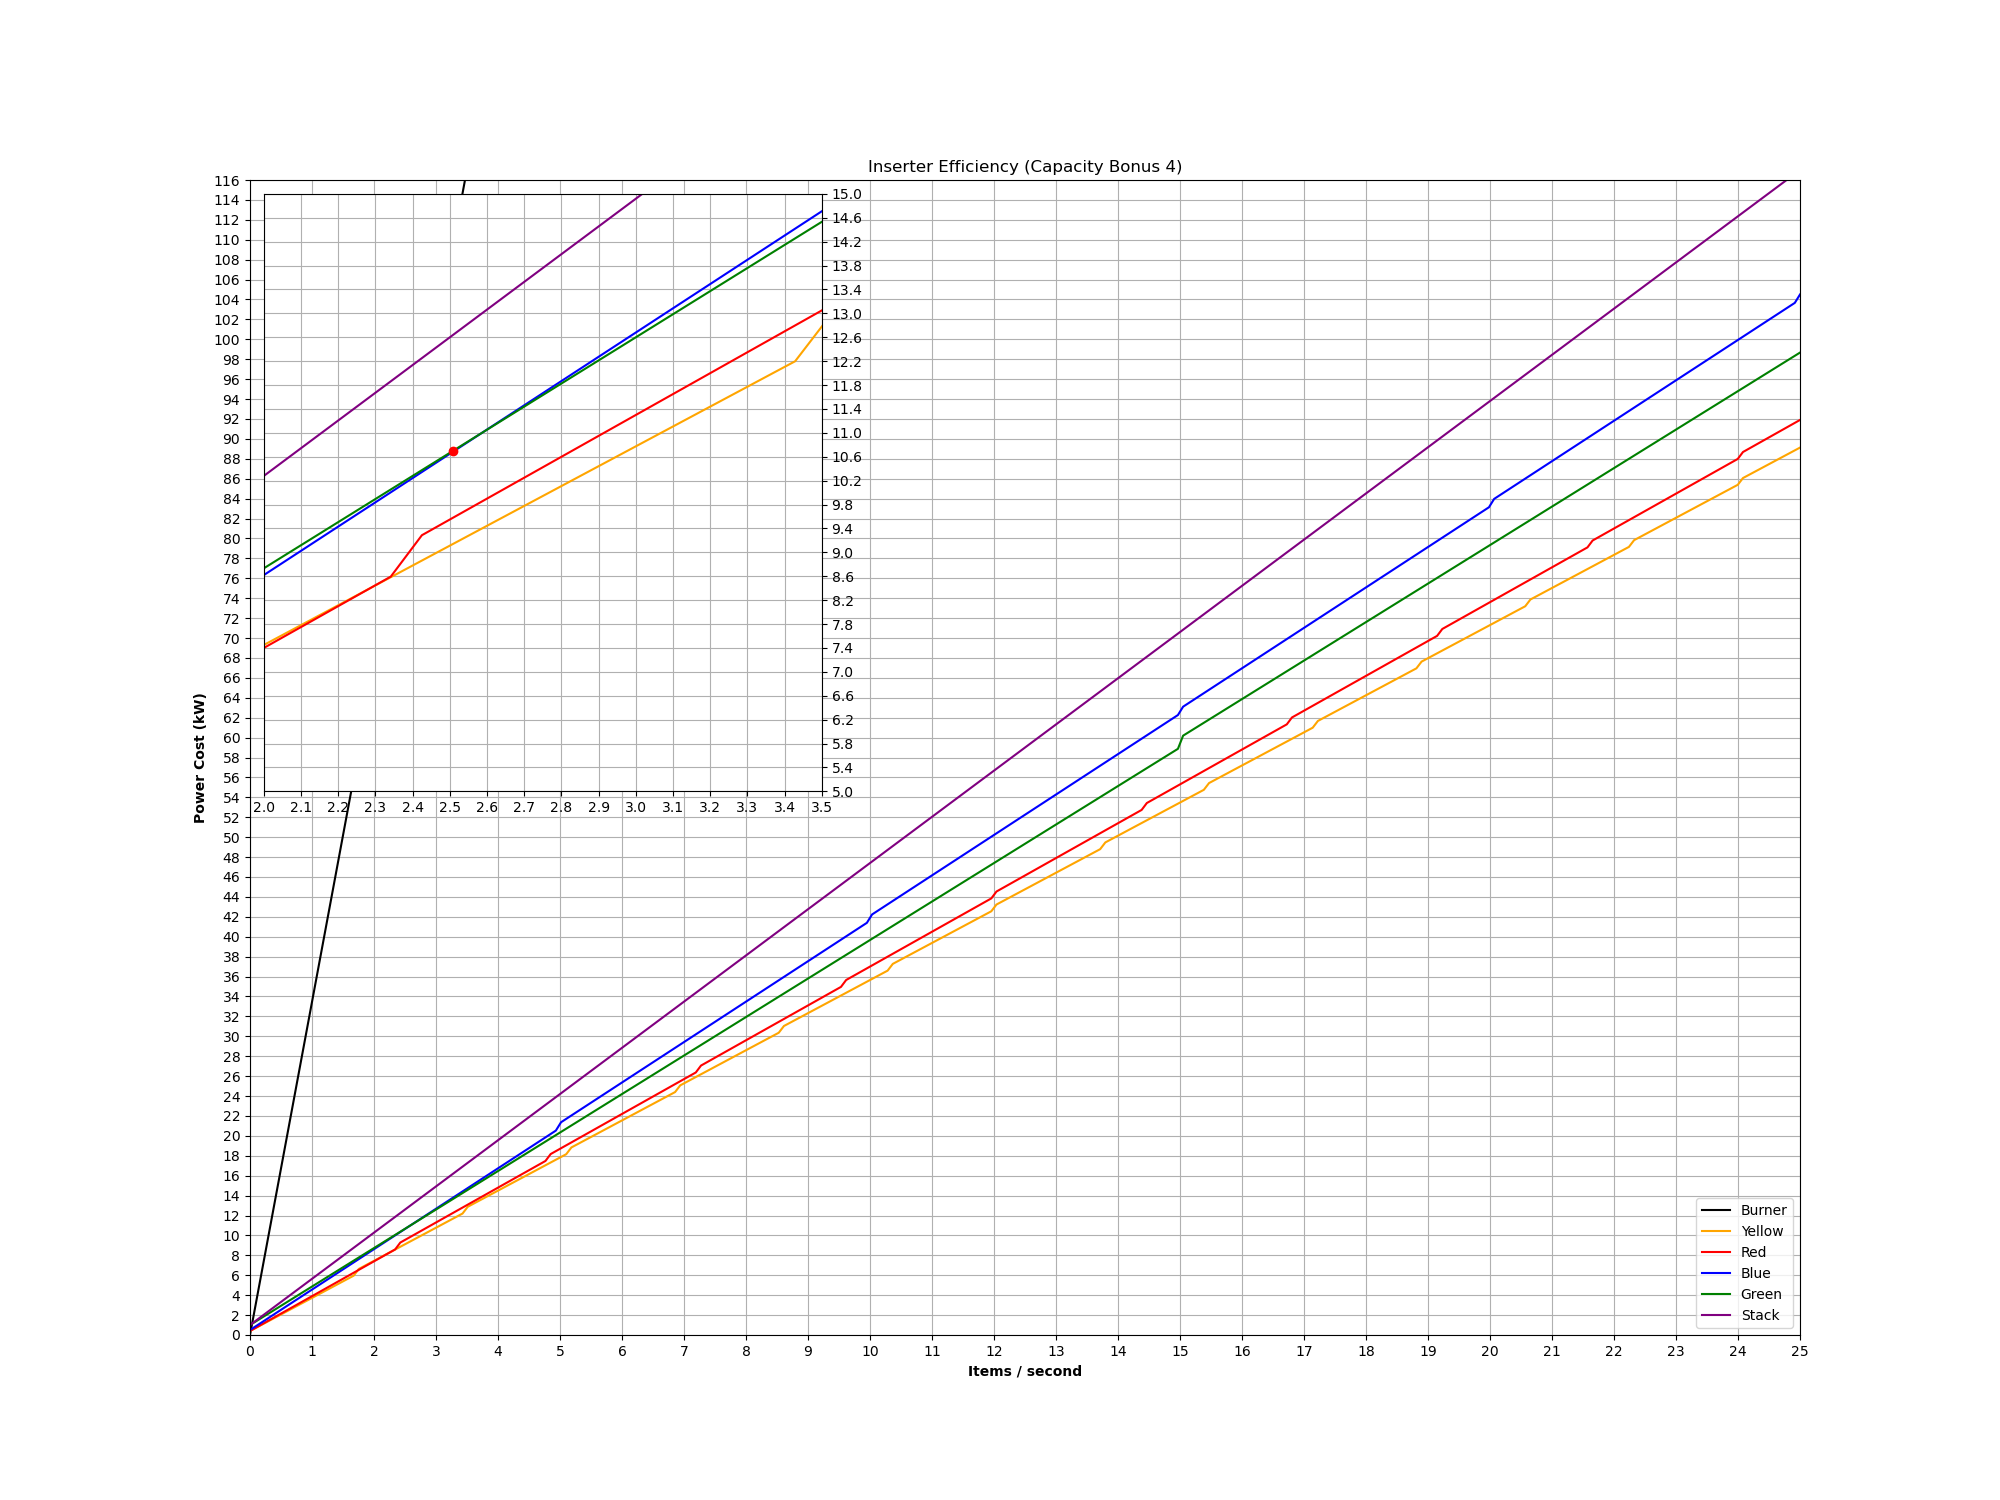 | 2,000 × 1,500 (262 KB) | GregFirehawk (talk | contribs) | Fixed mixed up file | |
| 05:14, 26 April 2025 |  | 800 × 600 (64 KB) | GregFirehawk (talk | contribs) | Fixed mixed up file | |
| 04:21, 26 April 2025 | 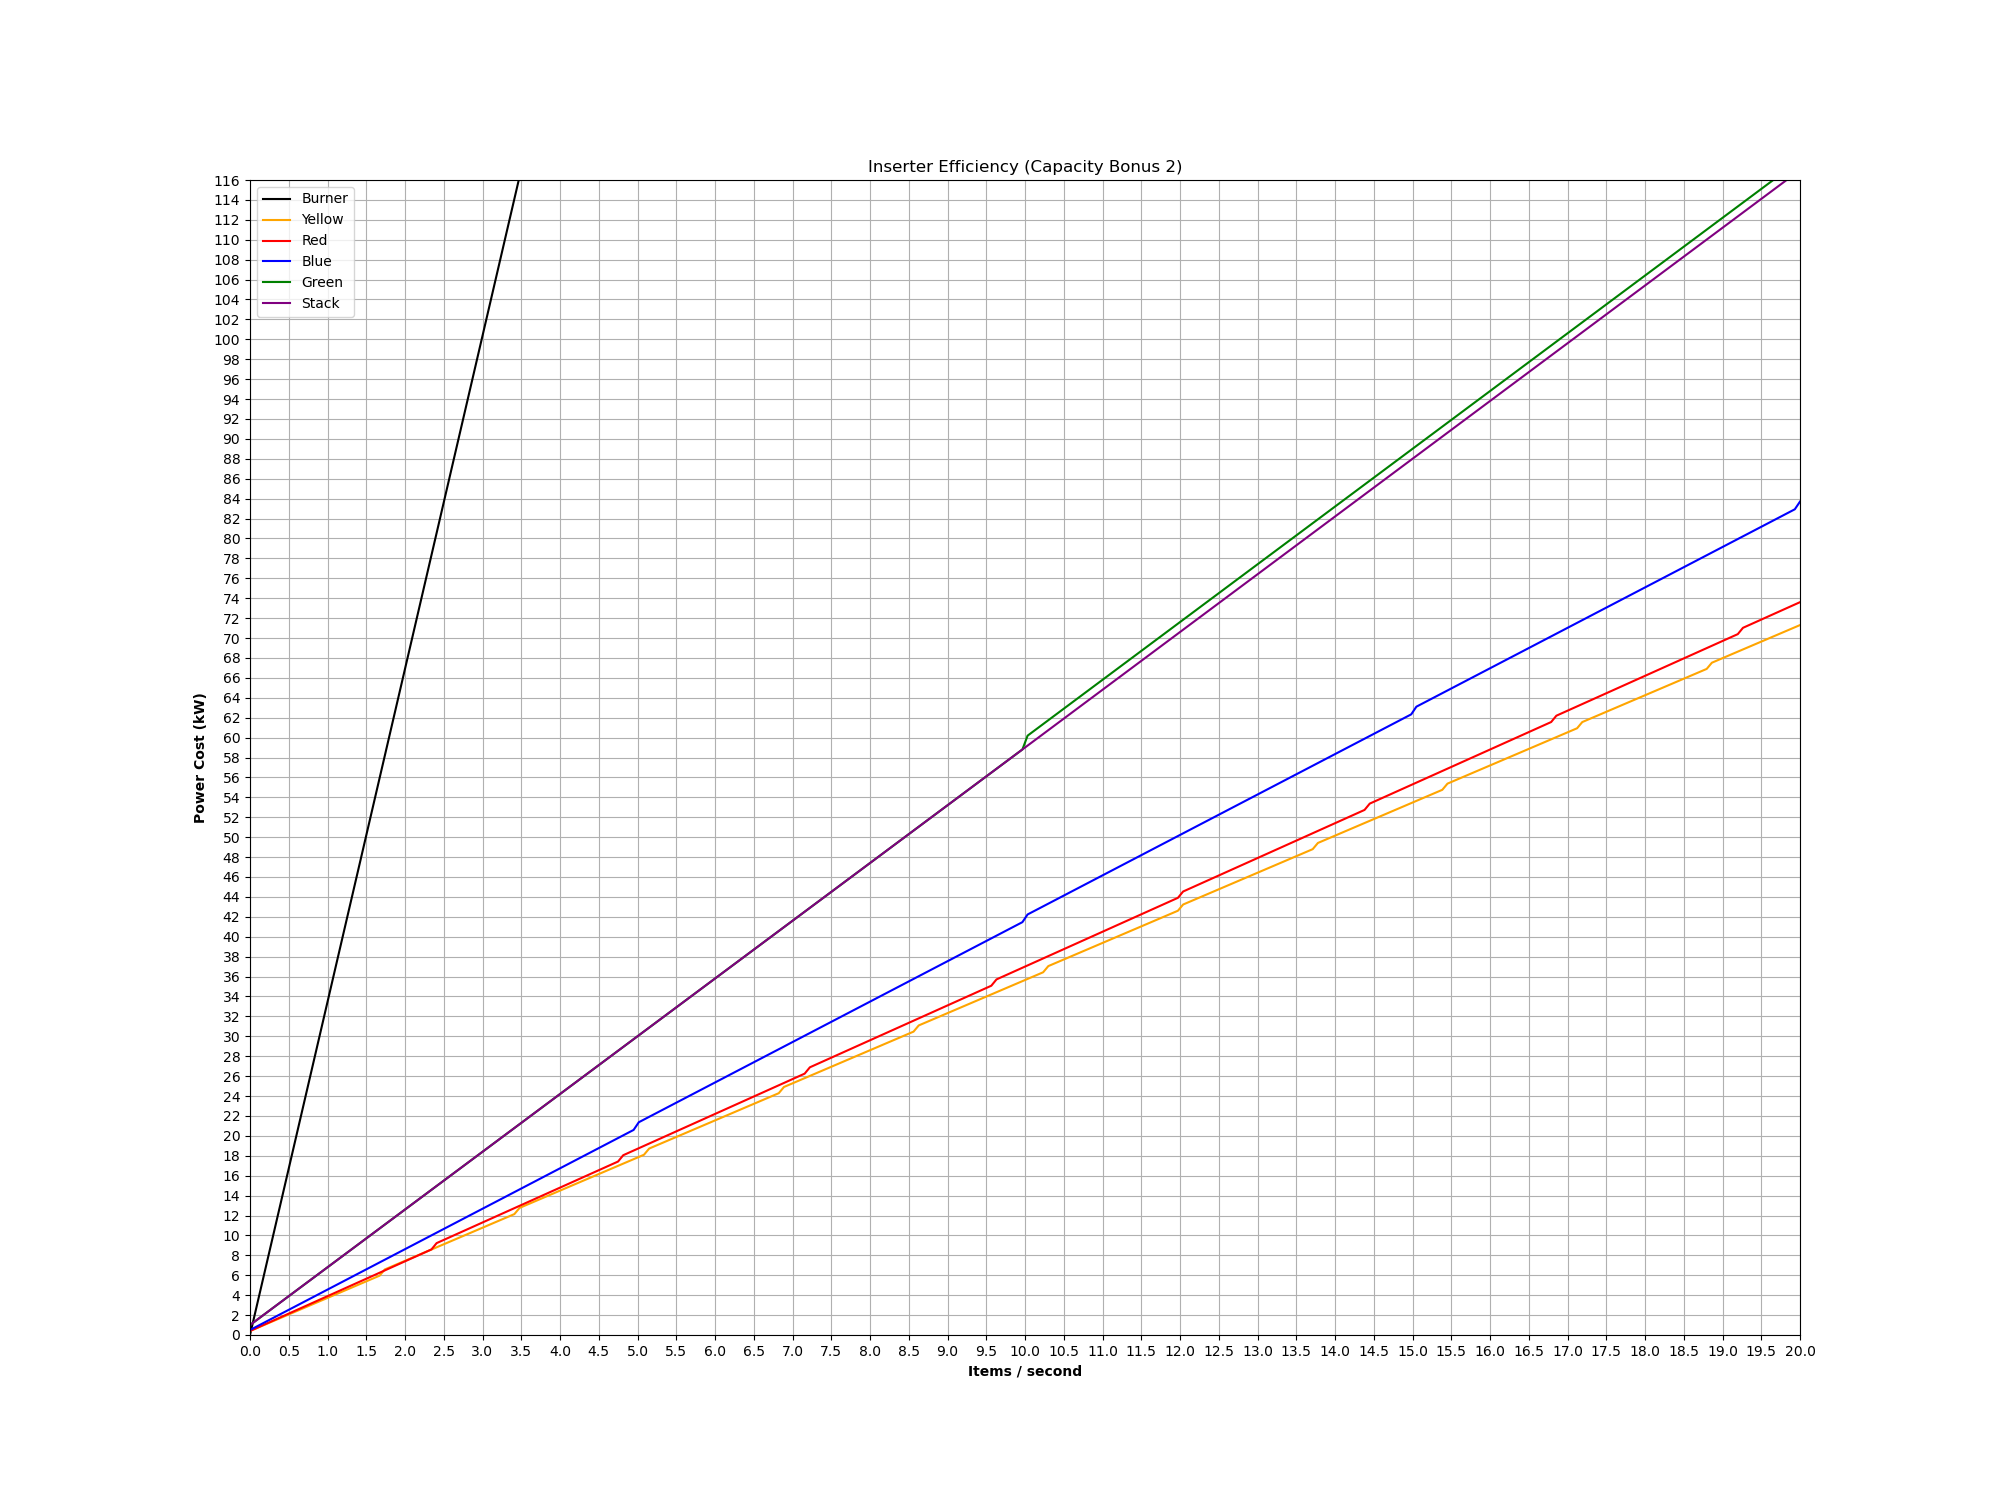 | 2,000 × 1,500 (205 KB) | GregFirehawk (talk | contribs) | Added Stack Inserter, fixed error | |
| 13:24, 9 January 2025 |  | 2,880 × 3,600 (577 KB) | GregFirehawk (talk | contribs) |
You cannot overwrite this file.
File usage
The following 2 pages use this file:
.png&oldid=213553)