File:Inserter Efficiency Graph (No Capacity Bonus).png: Difference between revisions
.png&diff=prev&oldid=213545)
.png&diff=next&oldid=213546)
GregFirehawk (talk | contribs) No edit summary |
GregFirehawk (talk | contribs) GregFirehawk uploaded a new version of File:Inserter Efficiency Graph (No Capacity Bonus).png |
||
(No difference)
| |||
.png&oldid=213545)
.png&action=edit&oldid=213545)
.png&oldid=213546)
.png&action=edit&oldid=213546)
.png)
Revision as of 03:58, 26 April 2025
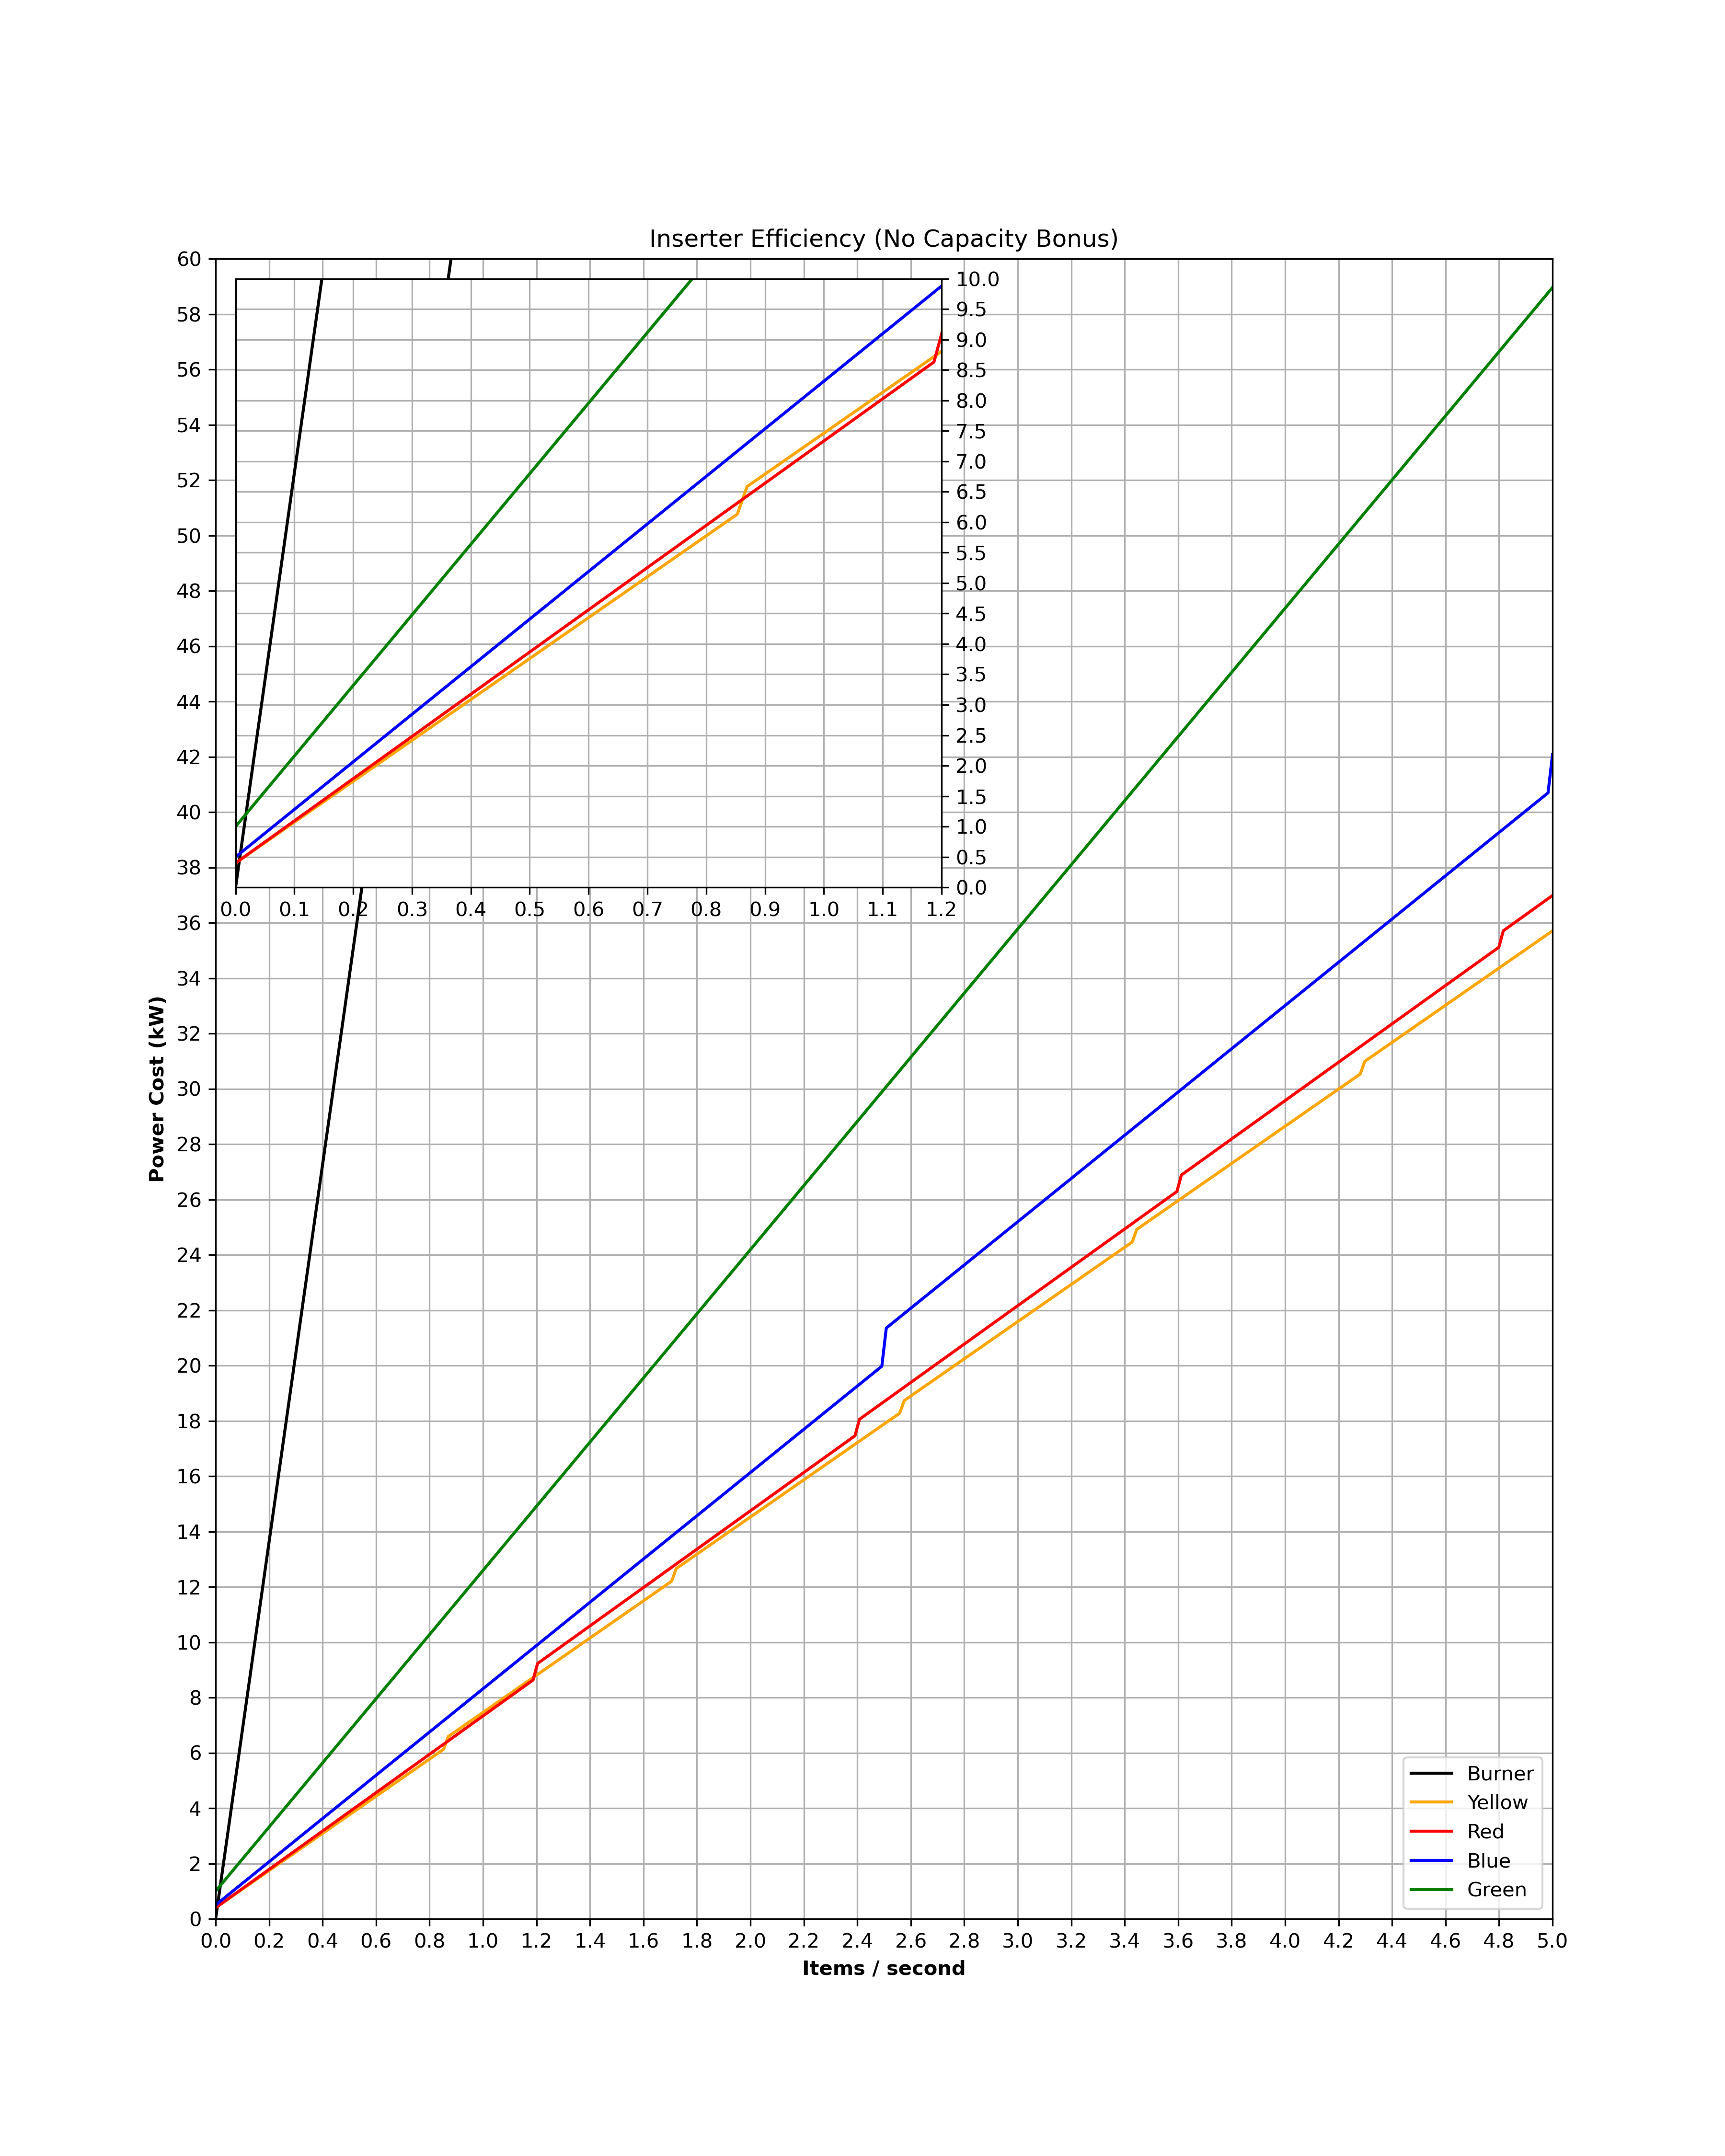
Graph showing efficiency of different inserters at different throughputs. This version has no capacity bonus. Intersection point has been marked with a dot.
This is the matplot code used to generate this graph in python, in case it needs to be updated:
import math
import matplotlib.pyplot as plt
import numpy as np
from mpl_toolkits.axes_grid1.inset_locator import zoomed_inset_axes
burner_speed = 60 / 76
yellow_speed = 60 / 70
red_speed = 60 / 50
blue_speed = 60 / 24
yellow_drain = 0.4
blue_drain = 0.5
green_drain = 1
burner_energy = 66.9
yellow_energy = 6.65
red_energy = 7
blue_energy = 8.12
green_energy = 23.2
stack_energy = 46.4
stack_size = 1
green_stack = 2
stack_stack = 6
x = np.linspace(0, blue_speed * stack_stack, 300)
yellow_count = np.trunc(x / (yellow_speed * stack_size)) + 1
red_count = np.trunc(x / (red_speed * stack_size)) + 1
blue_count = np.trunc(x / (blue_speed * stack_size)) + 1
green_count = np.trunc(x / (blue_speed * green_stack)) + 1
dynamic_stack = x / stack_size
dynamic_green = x / green_stack
dynamic_stacker = x / stack_stack
burner = burner_energy * dynamic_stack
yellow = (yellow_energy * dynamic_stack) + (yellow_drain * yellow_count)
red = (red_energy * dynamic_stack) + (yellow_drain * red_count)
blue = (blue_energy * dynamic_stack) + (blue_drain * blue_count)
green = (green_energy * dynamic_green) + (green_drain * green_count)
stack = (stack_energy * dynamic_stacker) + green_drain
fig = plt.figure(figsize = (20, 15))
ax = plt.axes()
ax.plot(x, burner, label = "Burner", color = "black")
ax.plot(x, yellow, label = "Yellow", color = "orange")
ax.plot(x, red, label = "Red", color = "red")
ax.plot(x, blue, label = "Blue", color = "blue")
ax.plot(x, green, label = "Green", color = "green")
ax.plot(x, stack, label = "Stack", color = "purple")
xlim = blue_speed * stack_stack
ylim = (stack_energy / stack_stack) * xlim
ax.set_ylim(0, ylim)
ax.set_xlim(0, xlim)
xtick = 0.5
ytick = 2
ax.set_xticks(np.arange(0, xlim + xtick, xtick))
ax.set_yticks(np.arange(0, ylim + ytick, ytick))
ax.set_title("Inserter Efficiency (No Capacity Bonus)")
ax.set_xlabel("Items / second", fontweight = "bold")
ax.set_ylabel("Power Cost (kW)", fontweight = "bold")
ax.grid()
ax.legend(loc = "best")
intersect = np.argwhere(np.diff(np.sign(blue - stack))).flatten()
plt.plot(x [intersect], stack[intersect] , 'ro')
plt.show()
The wiki seems to not parse line breaks correctly but that can easily be handled by the end user.
File history
Click on a date/time to view the file as it appeared at that time.
| Date/Time | Thumbnail | Dimensions | User | Comment | |
|---|---|---|---|---|---|
| current | 06:08, 6 May 2025 |  | 1,650 × 1,250 (63 KB) | Cardinal (talk | contribs) | Size formatted, higher compression ratio. |
| 23:28, 29 April 2025 |  | 2,000 × 1,500 (219 KB) | GregFirehawk (talk | contribs) | Reverted to version as of 03:58, 26 April 2025 (UTC) | |
| 23:20, 29 April 2025 | 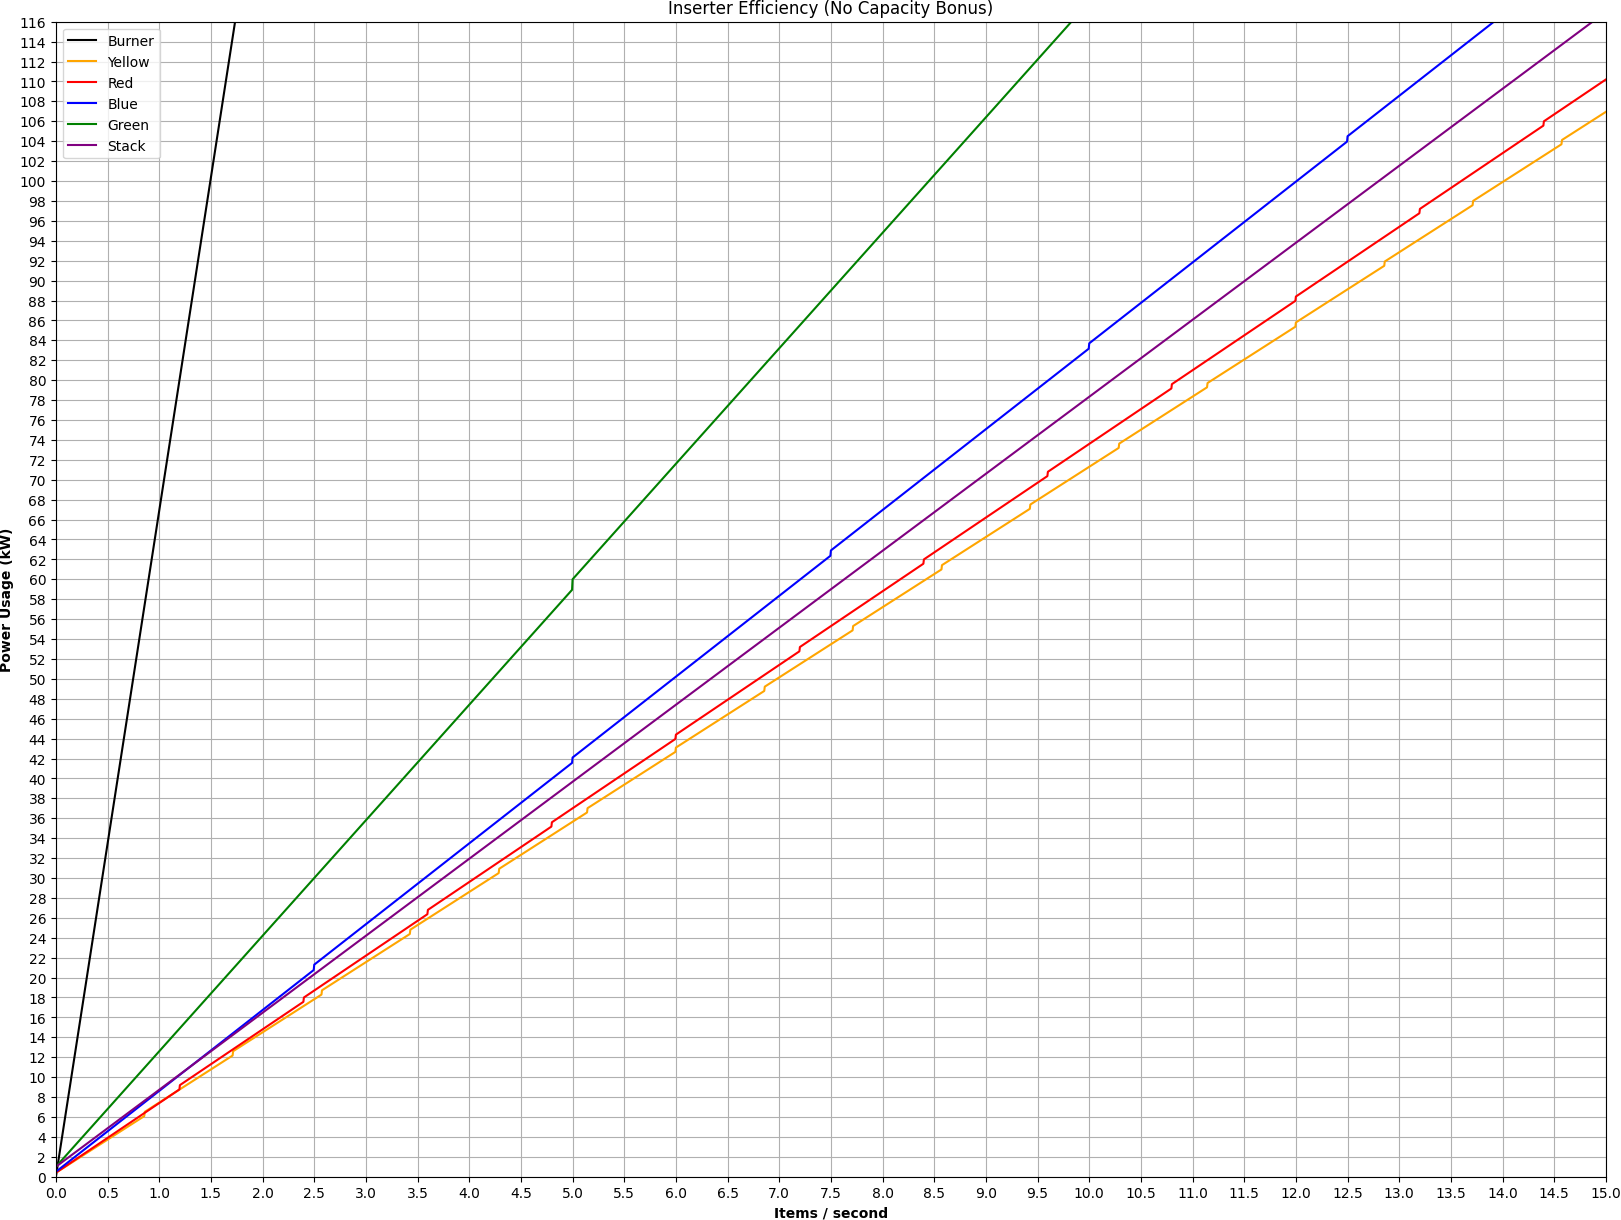 | 1,621 × 1,220 (211 KB) | GregFirehawk (talk | contribs) | Removed Dot | |
| 03:58, 26 April 2025 | 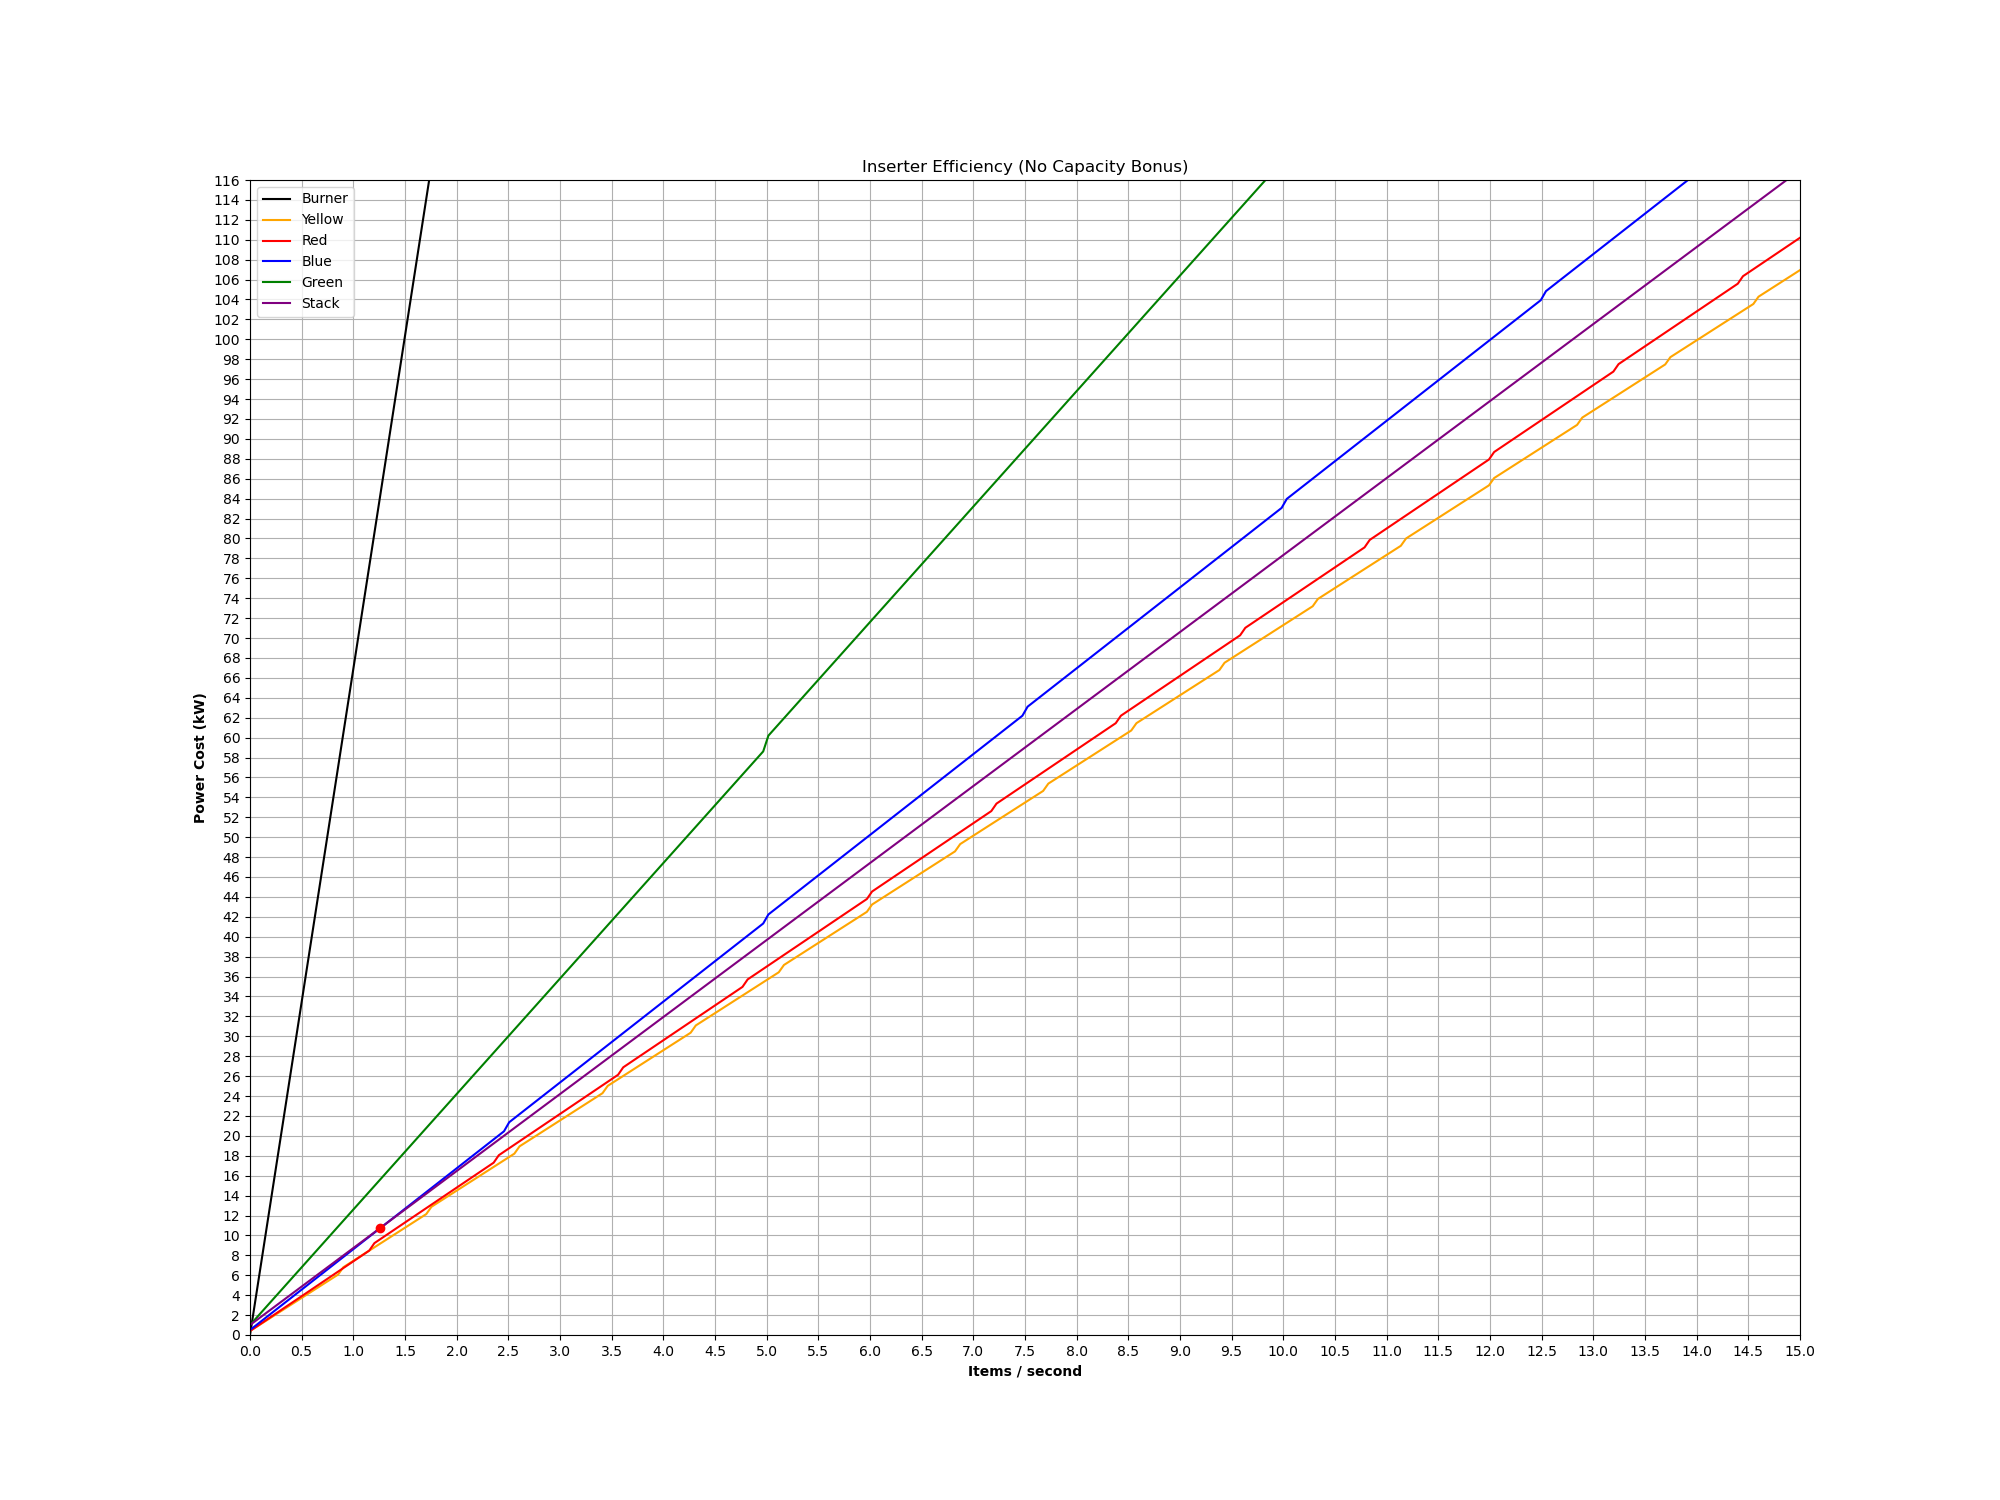 | 2,000 × 1,500 (219 KB) | GregFirehawk (talk | contribs) | Made dot red for better readability | |
| 03:51, 26 April 2025 |  | 2,000 × 1,500 (219 KB) | GregFirehawk (talk | contribs) | Added Stack Inserter, fixed error | |
| 13:13, 9 January 2025 | 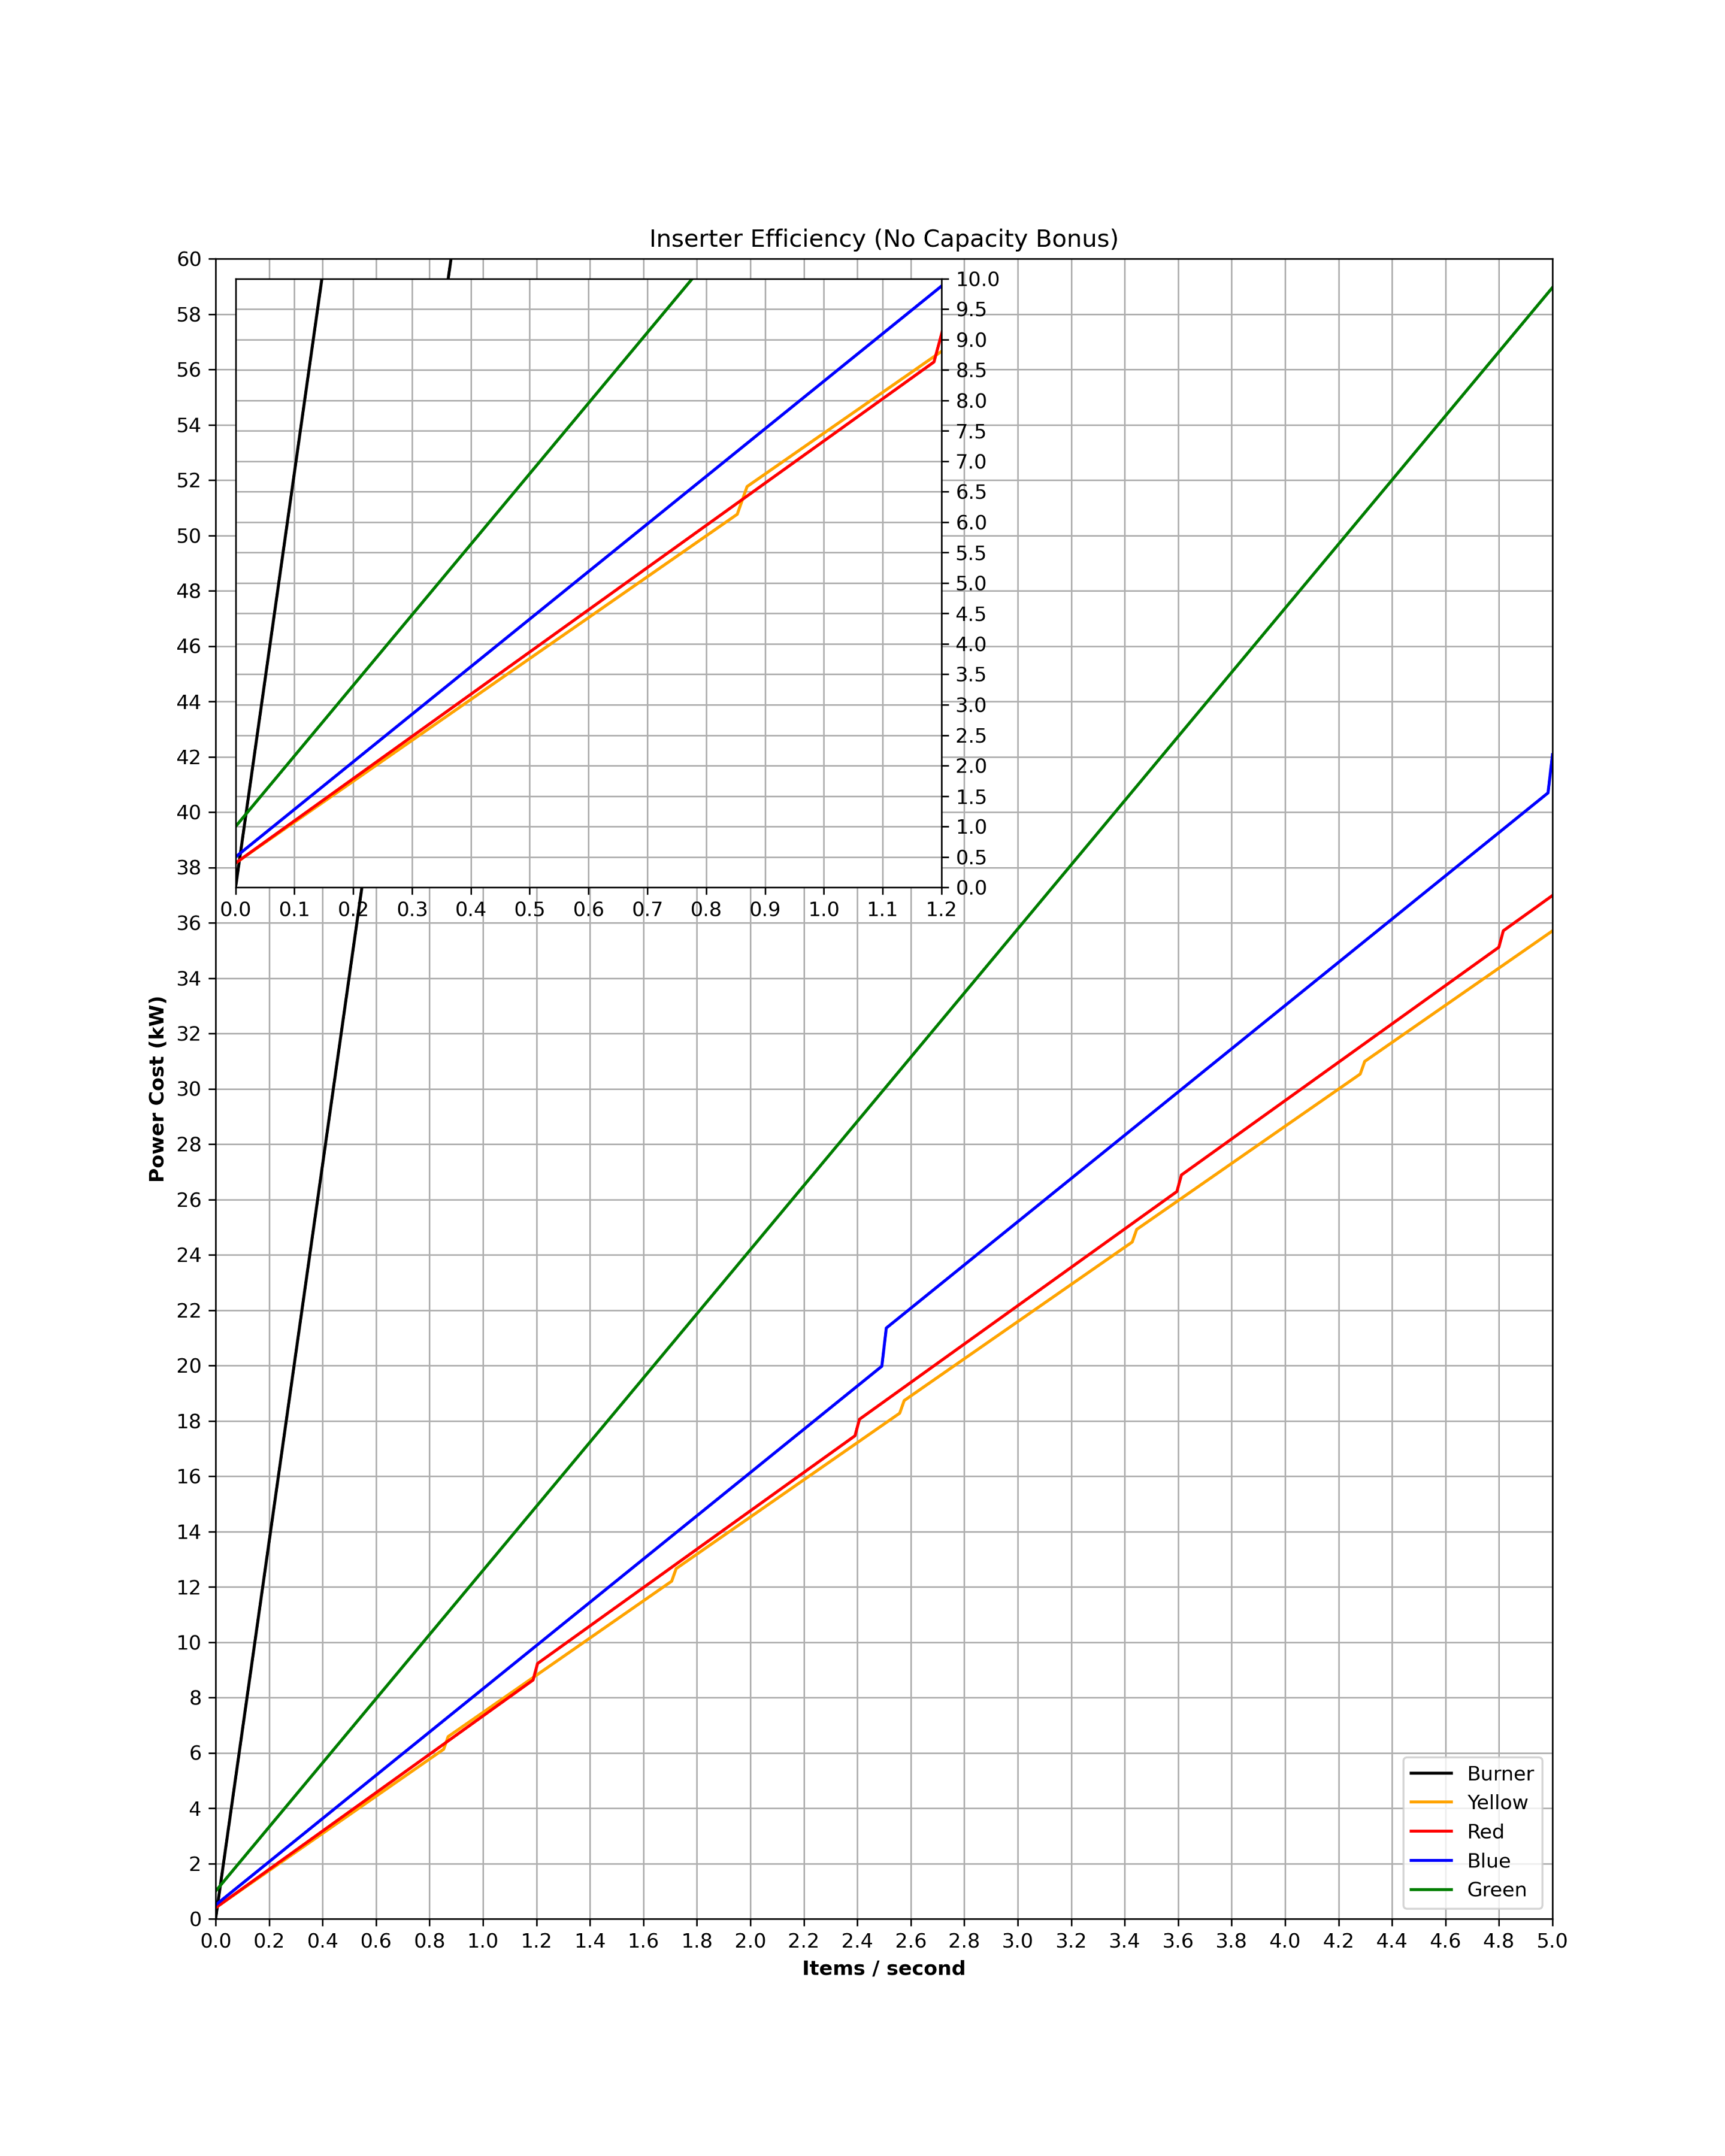 | 2,880 × 3,600 (609 KB) | GregFirehawk (talk | contribs) | Reduced resolution to below 12.5MP | |
| 13:08, 9 January 2025 | Error creating thumbnail: File with dimensions greater than 12.5 MP | 3,600 × 4,500 (613 KB) | GregFirehawk (talk | contribs) |
You cannot overwrite this file.
File usage
The following 2 pages use this file:
.png&oldid=213546)