File:Inserter Efficiency Graph (Capacity Bonus 5) .png: Difference between revisions
_.png&diff=prev&oldid=213561)
GregFirehawk (talk | contribs) GregFirehawk uploaded a new version of File:Inserter Efficiency Graph (Capacity Bonus 5) .png |
m Categorized. |
||
| (2 intermediate revisions by 2 users not shown) | |||
| Line 1: | Line 1: | ||
Graph showing efficiency of different inserters at different throughputs. This version has capacity bonus 5. Intersection points are marked. | Graph showing efficiency of different inserters at different throughputs. This version has capacity bonus 5. Intersection points are marked. | ||
{{ | {{C|Graphics}} | ||
Code to recreate if needed | Code to recreate if needed | ||
_.png&oldid=213561)
_.png&action=edit&oldid=213561)
_.png)
_.png&oldid=213826)
_.png&action=edit)
Latest revision as of 06:39, 7 May 2025
Graph showing efficiency of different inserters at different throughputs. This version has capacity bonus 5. Intersection points are marked.
Code to recreate if needed
import matplotlib.pyplot as plt
import numpy as np
from mpl_toolkits.axes_grid1.inset_locator import zoomed_inset_axes
burner_speed = 60 / 76
yellow_speed = 60 / 70
red_speed = 60 / 50
blue_speed = 60 / 24
yellow_drain = 0.4
blue_drain = 0.5
green_drain = 1
burner_energy = 66.9
yellow_energy = 6.65
red_energy = 7
blue_energy = 8.12
green_energy = 23.2
stack_energy = 46.4
stack_size = 2
green_stack = 8
stack_stack = 12
x = np.linspace(0, blue_speed * stack_stack, 300)
yellow_count = np.trunc(x / (yellow_speed * stack_size)) + 1
red_count = np.trunc(x / (red_speed * stack_size)) + 1
blue_count = np.trunc(x / (blue_speed * stack_size)) + 1
green_count = np.trunc(x / (blue_speed * green_stack)) + 1
dynamic_stack = x / stack_size
dynamic_green = x / green_stack
dynamic_stacker = x / stack_stack
burner = burner_energy * dynamic_stack
yellow = (yellow_energy * dynamic_stack) + (yellow_drain * yellow_count)
red = (red_energy * dynamic_stack) + (yellow_drain * red_count)
blue = (blue_energy * dynamic_stack) + (blue_drain * blue_count)
green = (green_energy * dynamic_green) + (green_drain * green_count)
stack = (stack_energy * dynamic_stacker) + green_drain
fig = plt.figure(figsize = (20, 15))
ax = plt.axes()
ax.plot(x, burner, label = "Burner", color = "black")
ax.plot(x, yellow, label = "Yellow", color = "orange")
ax.plot(x, red, label = "Red", color = "red")
ax.plot(x, blue, label = "Blue", color = "blue")
ax.plot(x, green, label = "Green", color = "green")
ax.plot(x, stack, label = "Stack", color = "purple")
xlim = blue_speed * stack_stack
ylim = (stack_energy / stack_stack) * xlim
ax.set_ylim(0, ylim)
ax.set_xlim(0, xlim)
xtick = 1
ytick = 2
ax.set_xticks(np.arange(0, xlim + xtick, xtick))
ax.set_yticks(np.arange(0, ylim + ytick, ytick))
ax.set_title("Inserter Efficiency (Capacity Bonus 5)")
ax.set_xlabel("Items / second", fontweight = "bold")
ax.set_ylabel("Power Cost (kW)", fontweight = "bold")
ax.grid()
ax.legend(loc = 4)
intersect4 = np.argwhere(np.diff(np.sign(stack - blue))).flatten()
plt.plot(x[intersect4], stack[intersect4] , 'ro')
zax = zoomed_inset_axes(ax, 8, loc = 2, borderpad = 1)
zax.yaxis.tick_right()
zax.plot(x, burner, label = "Burner", color = "black")
zax.plot(x, yellow, label = "Yellow", color = "orange")
zax.plot(x, red, label = "Red", color = "red")
zax.plot(x, blue, label = "Blue", color = "blue")
zax.plot(x, green, label = "Green", color = "green")
zax.plot(x, stack, label = "Stack", color = "purple")
zxlim = 1.6
zylim = 6
zxinit = 0
zyinit = 0
zax.set_xlim(zxinit, zxlim)
zax.set_ylim(zyinit, zylim)
zxtick = 0.1
zytick = 0.2
zax.set_xticks(np.arange(zxinit, zxlim + zxtick, zxtick))
zax.set_yticks(np.arange(zyinit, zylim + zytick, zytick))
zax.grid()
intersect1 = np.argwhere(np.diff(np.sign(green - blue))).flatten()
plt.plot(x[intersect1], green[intersect1] , 'ro')
intersect2 = np.argwhere(np.diff(np.sign(green - red))).flatten()
plt.plot(x[intersect2], green[intersect2] , 'ro')
intersect3 = np.argwhere(np.diff(np.sign(green - yellow))).flatten()
plt.plot(x[intersect3], green[intersect3] , 'ro')
intersect4 = np.argwhere(np.diff(np.sign(stack - blue))).flatten()
plt.plot(x[intersect4], stack[intersect4] , 'ro')
plt.show()
File history
Click on a date/time to view the file as it appeared at that time.
| Date/Time | Thumbnail | Dimensions | User | Comment | |
|---|---|---|---|---|---|
| current | 06:07, 6 May 2025 |  | 1,650 × 1,250 (74 KB) | Cardinal (talk | contribs) | Size formatted, higher compression ratio. |
| 07:40, 26 April 2025 | 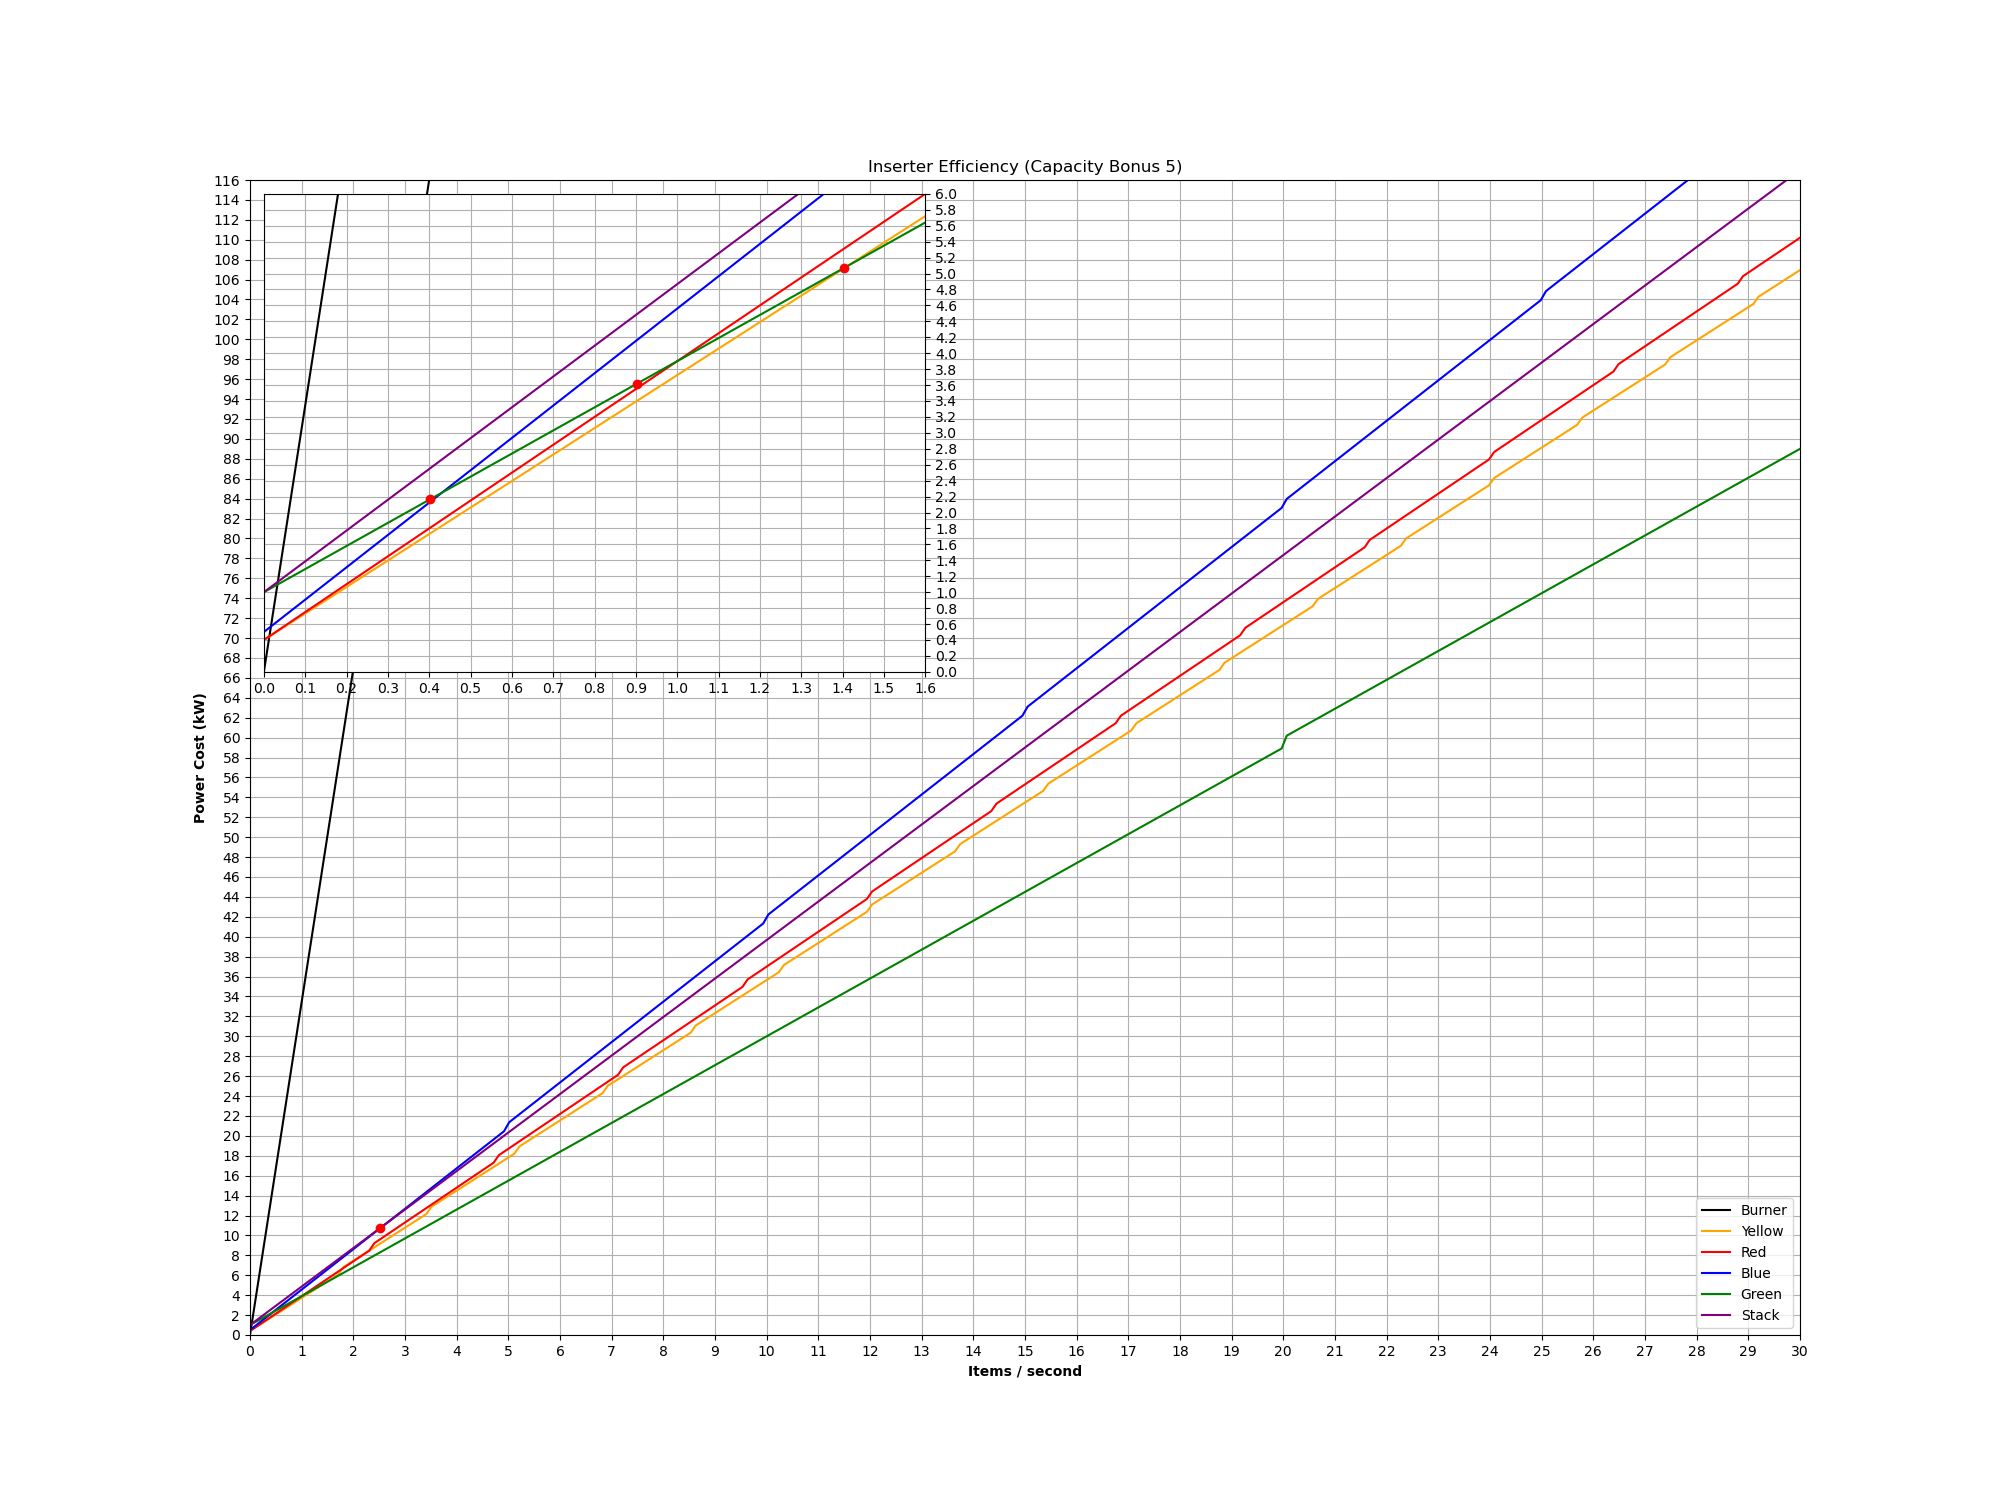 | 2,000 × 1,500 (283 KB) | GregFirehawk (talk | contribs) | Reverted to version as of 05:29, 26 April 2025 (UTC) | |
| 05:38, 26 April 2025 |  | 120 × 90 (6 KB) | GregFirehawk (talk | contribs) | undid mixup | |
| 05:36, 26 April 2025 |  | 2,000 × 1,500 (199 KB) | GregFirehawk (talk | contribs) | Added Stack Inserter, fixed error, added dots at intersections | |
| 05:29, 26 April 2025 |  | 2,000 × 1,500 (283 KB) | GregFirehawk (talk | contribs) | Added Stack Inserter, fixed error, added dots at intersections | |
| 13:28, 9 January 2025 |  | 2,880 × 3,600 (551 KB) | GregFirehawk (talk | contribs) |
You cannot overwrite this file.
File usage
The following 2 pages use this file:
_.png&oldid=213826)