File:Inserter Efficiency Graph (Capacity Bonus 2).png: Difference between revisions
.png&diff=prev&oldid=213750)
Cardinal uploaded a new version of File:Inserter Efficiency Graph (Capacity Bonus 2).png |
m Categorized. |
||
| Line 1: | Line 1: | ||
Graph showing the efficiency of Inserters at capacity bonus 2. Worth observing is how Stack Inserters and Green Inserters are identically efficient at this stage. | Graph showing the efficiency of Inserters at capacity bonus 2. Worth observing is how Stack Inserters and Green Inserters are identically efficient at this stage. | ||
{{C|Graphics}} | |||
Code to recreate if needed | Code to recreate if needed | ||
.png&oldid=213750)
.png&action=edit&oldid=213750)
.png)
.png&oldid=213824)
.png&action=edit)
Latest revision as of 06:38, 7 May 2025
Graph showing the efficiency of Inserters at capacity bonus 2. Worth observing is how Stack Inserters and Green Inserters are identically efficient at this stage.
Code to recreate if needed
import matplotlib.pyplot as plt
import numpy as np
burner_speed = 60 / 76
yellow_speed = 60 / 70
red_speed = 60 / 50
blue_speed = 60 / 24
yellow_drain = 0.4
blue_drain = 0.5
green_drain = 1
burner_energy = 66.9
yellow_energy = 6.65
red_energy = 7
blue_energy = 8.12
green_energy = 23.2
stack_energy = 46.4
stack_size = 2
green_stack = 4
stack_stack = 8
x = np.linspace(0, blue_speed * stack_stack, 300)
yellow_count = np.trunc(x / (yellow_speed * stack_size)) + 1
red_count = np.trunc(x / (red_speed * stack_size)) + 1
blue_count = np.trunc(x / (blue_speed * stack_size)) + 1
green_count = np.trunc(x / (blue_speed * green_stack)) + 1
dynamic_stack = x / stack_size
dynamic_green = x / green_stack
dynamic_stacker = x / stack_stack
burner = burner_energy * dynamic_stack
yellow = (yellow_energy * dynamic_stack) + (yellow_drain * yellow_count)
red = (red_energy * dynamic_stack) + (yellow_drain * red_count)
blue = (blue_energy * dynamic_stack) + (blue_drain * blue_count)
green = (green_energy * dynamic_green) + (green_drain * green_count)
stack = (stack_energy * dynamic_stacker) + green_drain
fig = plt.figure(figsize = (20, 15))
ax = plt.axes()
ax.plot(x, burner, label = "Burner", color = "black")
ax.plot(x, yellow, label = "Yellow", color = "orange")
ax.plot(x, red, label = "Red", color = "red")
ax.plot(x, blue, label = "Blue", color = "blue")
ax.plot(x, green, label = "Green", color = "green")
ax.plot(x, stack, label = "Stack", color = "purple")
xlim = blue_speed * stack_stack
ylim = (stack_energy / stack_stack) * xlim
ax.set_ylim(0, ylim)
ax.set_xlim(0, xlim)
xtick = 0.5
ytick = 2
ax.set_xticks(np.arange(0, xlim + xtick, xtick))
ax.set_yticks(np.arange(0, ylim + ytick, ytick))
ax.set_title("Inserter Efficiency (Capacity Bonus 2)")
ax.set_xlabel("Items / second", fontweight = "bold")
ax.set_ylabel("Power Cost (kW)", fontweight = "bold")
ax.grid()
ax.legend(loc = "best")
plt.show()
File history
Click on a date/time to view the file as it appeared at that time.
| Date/Time | Thumbnail | Dimensions | User | Comment | |
|---|---|---|---|---|---|
| current | 06:18, 6 May 2025 | 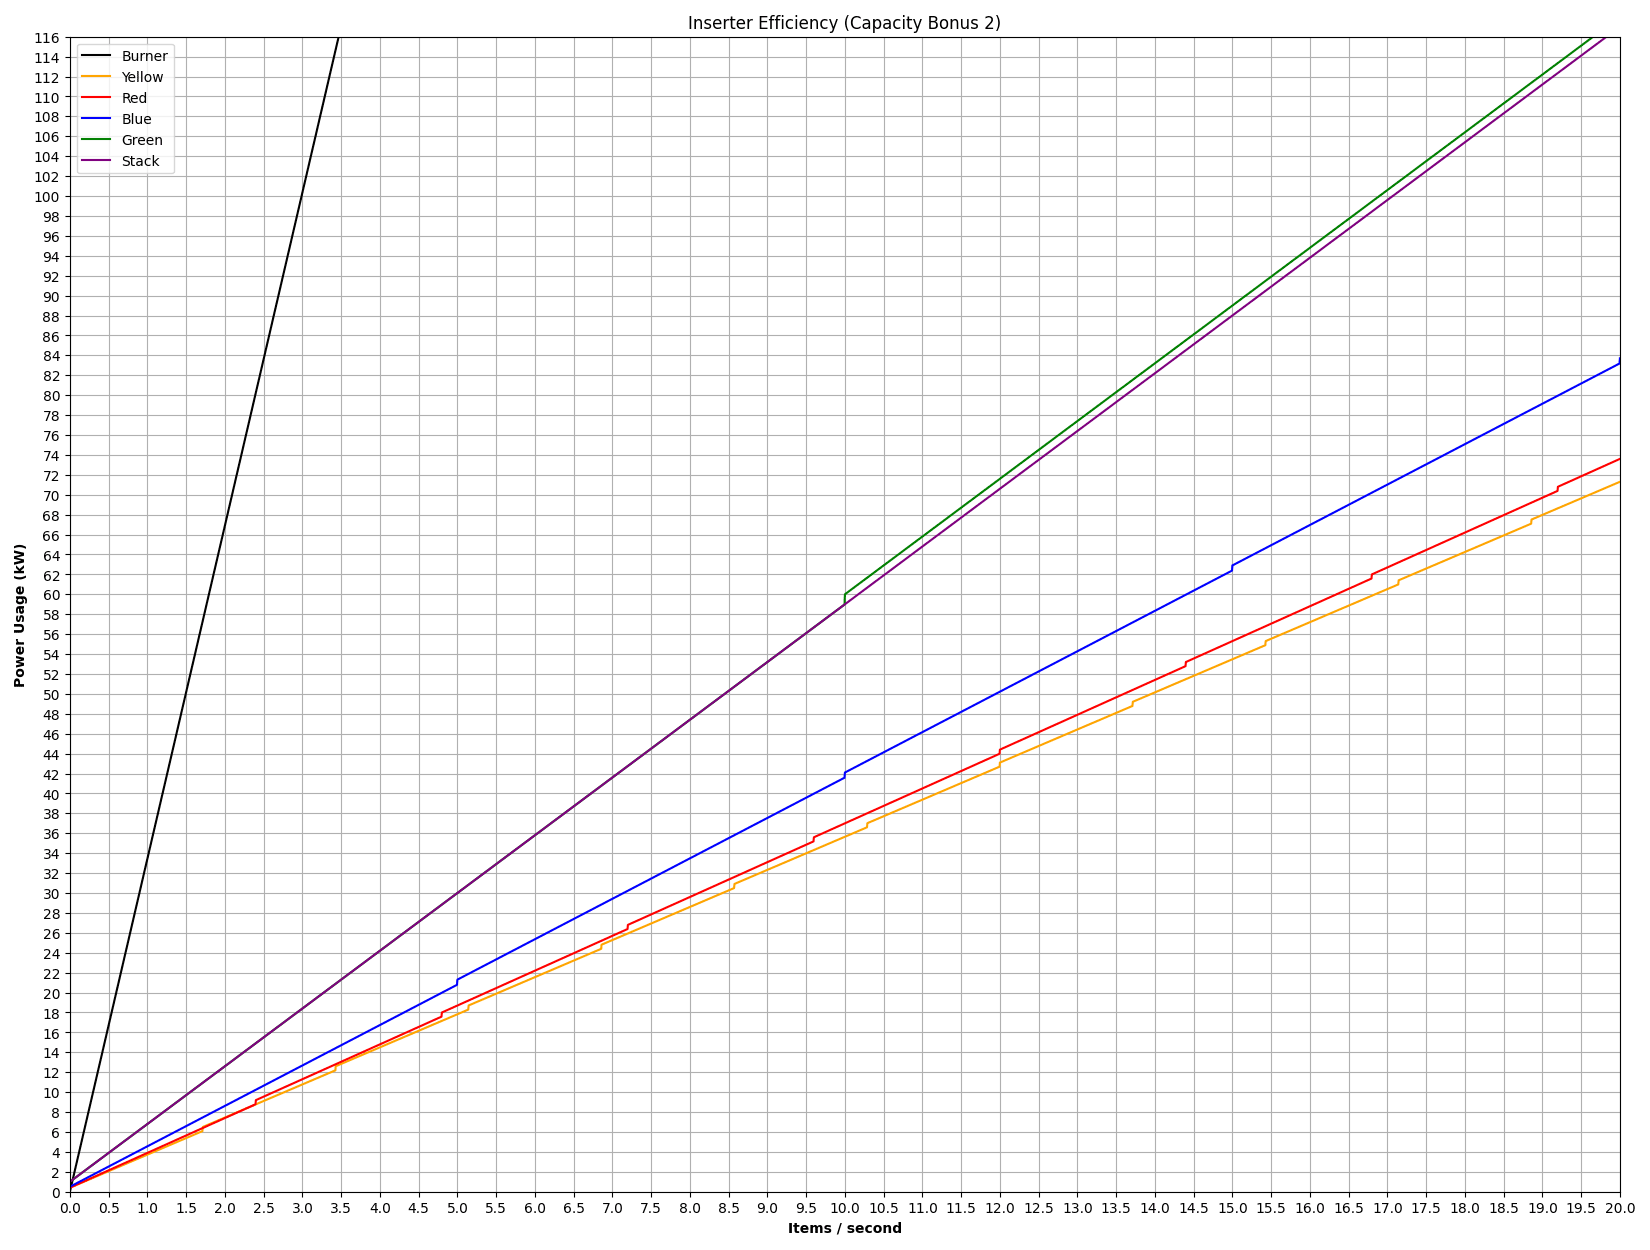 | 1,650 × 1,250 (55 KB) | Cardinal (talk | contribs) | Size formatted, higher compression ratio. |
| 23:30, 29 April 2025 |  | 1,621 × 1,220 (197 KB) | GregFirehawk (talk | contribs) | Fixed typo | |
| 23:24, 29 April 2025 |  | 1,621 × 1,220 (197 KB) | GregFirehawk (talk | contribs) | Updated Resolution | |
| 07:00, 26 April 2025 |  | 800 × 600 (64 KB) | GregFirehawk (talk | contribs) |
You cannot overwrite this file.
File usage
The following 2 pages use this file:
.png&oldid=213824)